Summary
- The average sold price of detached homes in the Greater Toronto Area increased by 5% in May from April but decreased 0.9% year-over-year (YoY)
- Sales of detached homes have decreased 50.6% YoY, but increased 52% in May from April
- Increases in the number of new listings and detached home sales, as well as rises in sold price, suggest buyers and sellers are returning to the market
- The average sold price for apartments has increased 6% YoY and 3% in May from April
- New listings, the average sold price, and number of sales for apartments have all risen
The full-extent of the economic impacts of the COVID-19 pandemic is yet to be realized. The lockdown measures taken as a result of the disease caused by the novel coronavirus has spared very few industries, the real estate market being no exception. Despite a gradual easing of COVID-related social and commercial restrictions, market indicators pertaining to detached homes in the GTA are mixed.
According to its most recent monthly report, the Toronto Real Estate Board (TREB) assessed that sales of detached homes in May 2020 declined at a rate of 50.6% year-over-year. By comparison, May’s drop in sales was less severe than in April, where 66% fewer homes were sold on a YOY basis. The average sold price of detached homes dropped by 0.9% YoY; but increased by 5% from April 2020 to May 2020. These month-over-month improvements suggest preliminary signs of a market rebound.
Figure 1. shows benchmark prices of single-family detached homes in nine GTA cities. According to the TREB monthly report, benchmark prices of single-family detached homes have increased 7.55% YoY. This was the case across all nine cities examined.
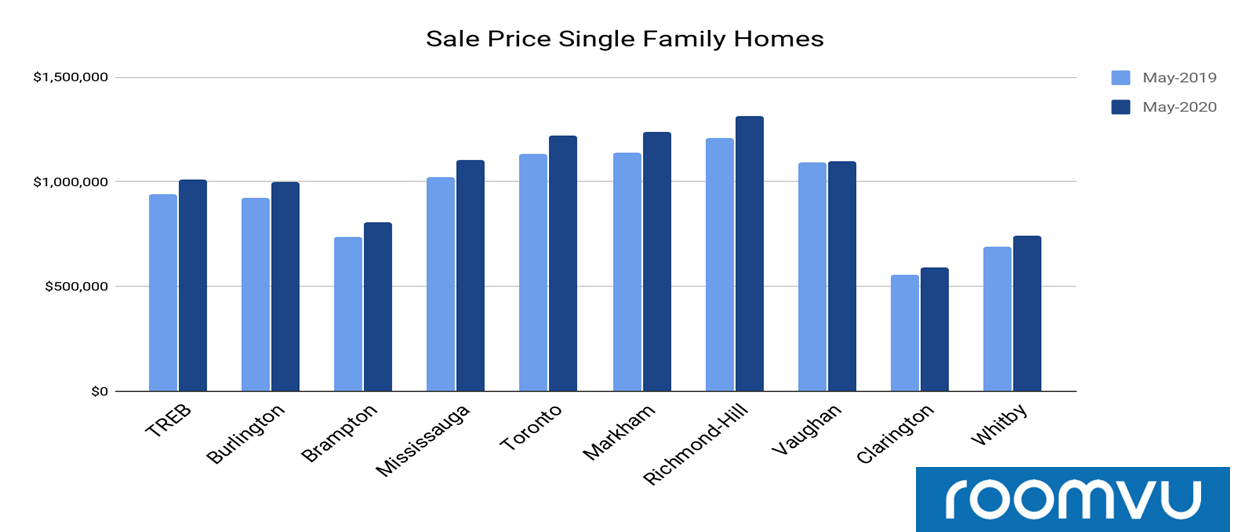
Despite increases in all nine cities, the increases varied by city. Prices rose the most in Brampton and Markham (9.74% and 8.62% respectively). The lowest increase was in Vaughn (0.38%).
Figure 2. shows the average sold price of detached homes. The average sold prices have risen since April, indicating the market is improving.
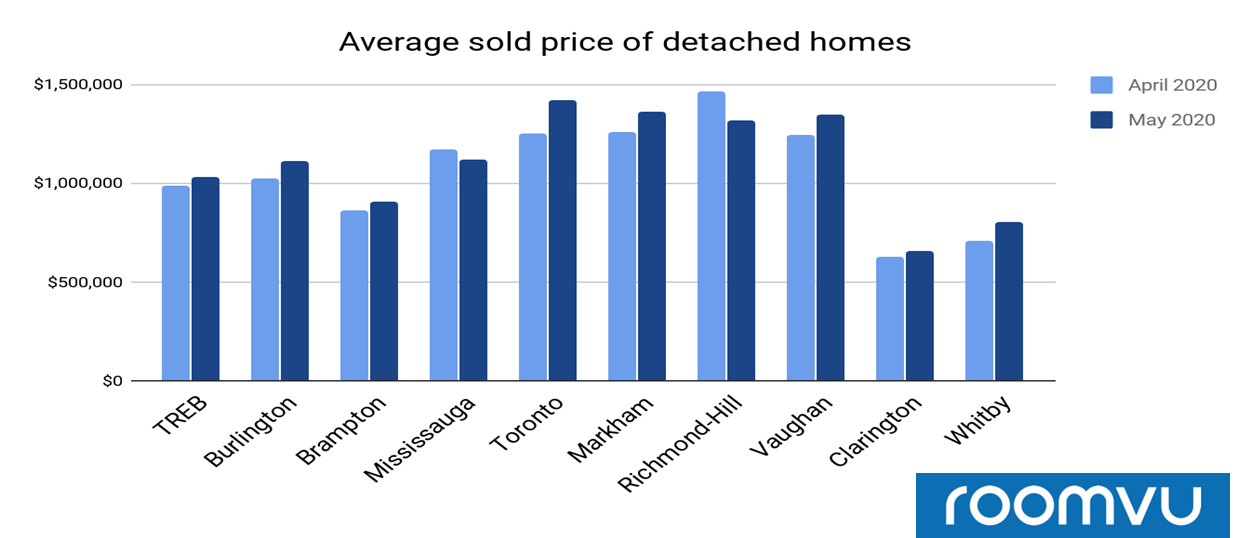
Even with the prevailing COVID situation, the average sold price of detached homes experienced a gain of 5% from April 2020 to May 2020 in Greater Toronto. A rise in prices can be observed across all the cities except Mississauga.
Figure 3. shows the number of new listings of detached homes. New listings have spiked by 52% in Greater Toronto indicating a return of sellers to the market.
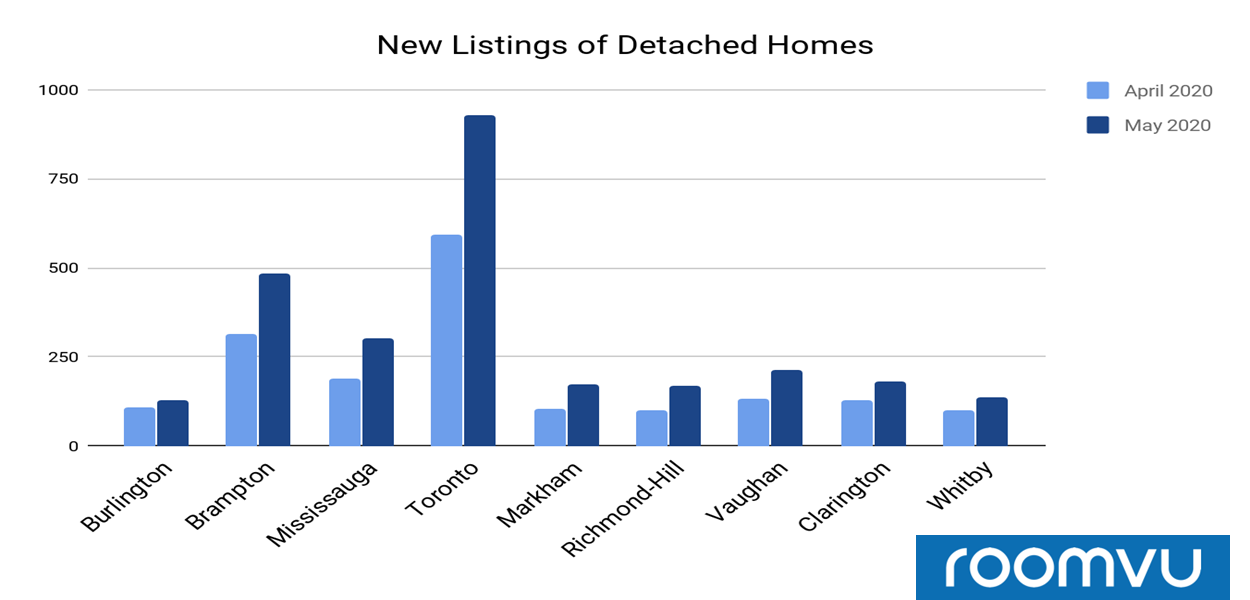
An increase was observed in all nine cities from April to May 2020; most dramatically in Markham and Richmond Hill (69% and 66% respectively). The lowest increase was in Burlington (18%).
Figure 4. shows the number of detached home sales from April 2020 to May 2020. Sales of detached homes increased by 61% on average during this time, with increases observed in all nine cities. The increases were most pronounced in Vaughan, Markham, and Whitby.
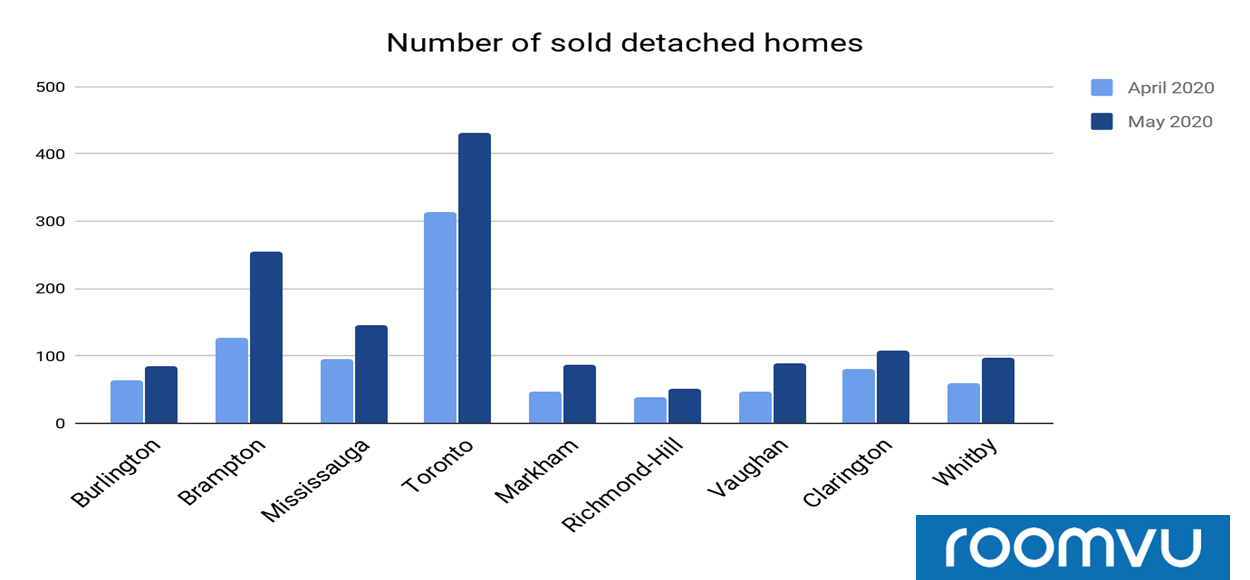
Figure 5. illustrates the average LDOM—the average days detached homes remained listed on the market. The number of days detached homes spent on the market increased in May compared to April.
Homes in April may have been listed and shown to prospective buyers prior to COVID-related lockdown measures, whereas those in May were listed during COVID lockdowns, resulting in delays to sale. This could explain the higher LDOM in May.
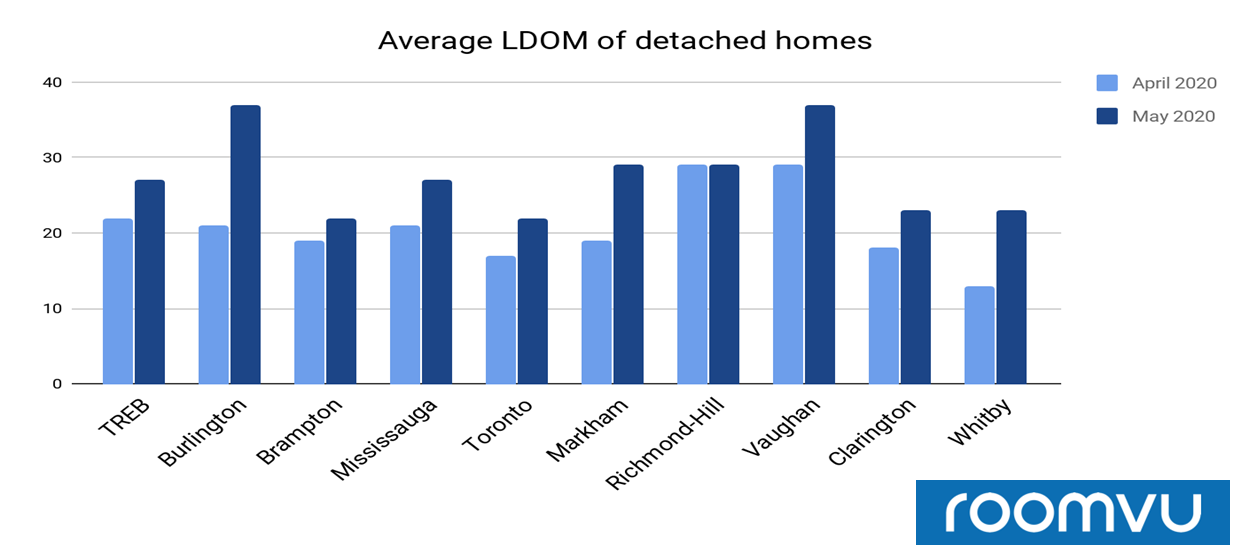
The LDOM for detached homes increased by 22% in the GTA. The number increased in all cities except Richmond Hill.
Apartments
The same TREB report examined apartment sales and sale prices. Like single-family homes, apartment sales have declined 60.4% YoY in May. By comparison, sales in April were down 71.6% YoY. Sold prices rose 6% YoY and 3% from April to May 2020.
Figure 1. shows the benchmark prices of apartments in nine GTA cities. Benchmark prices for apartments have increased by 12.19% YoY and risen across all the cities from May 2019 to May 2020.
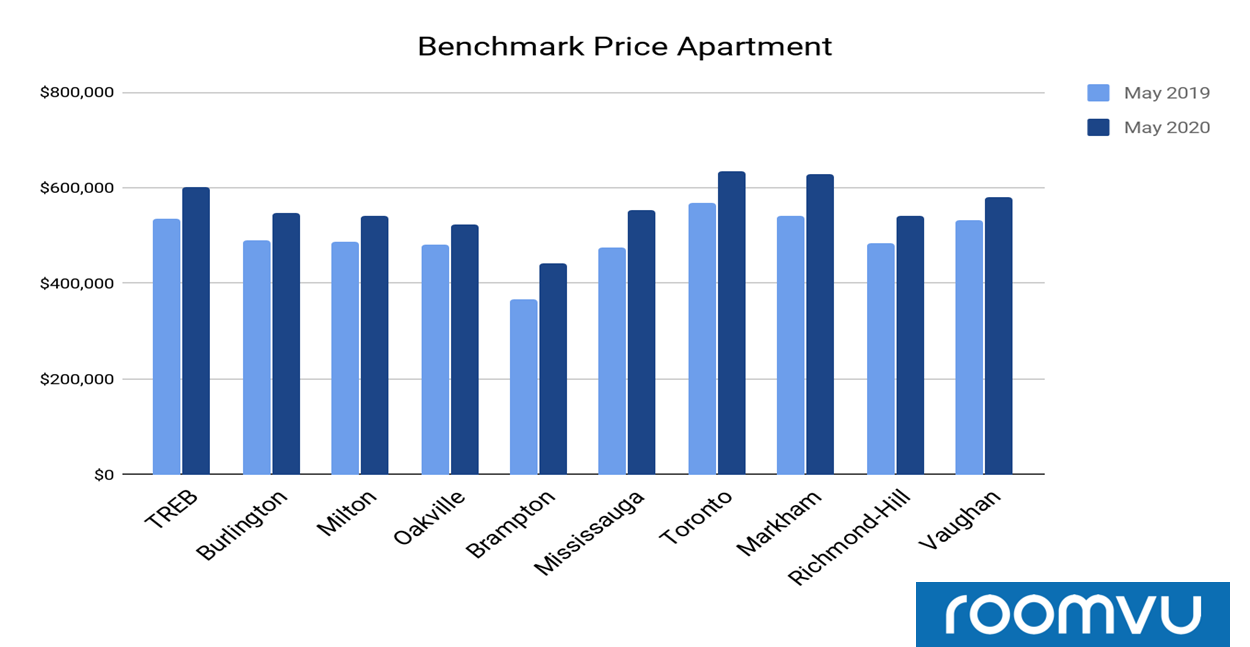
Figure 2 shows average sold prices of GTA apartments in May versus April 2020; prices have risen since April.
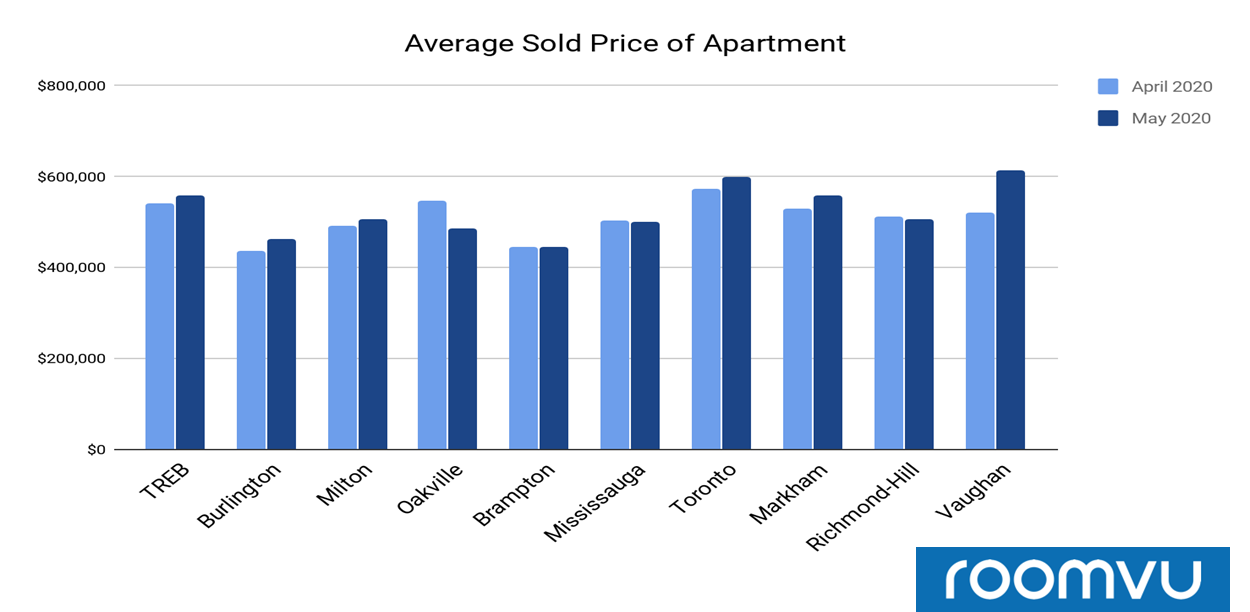
In Greater Toronto, the average sold price increased by 3% in May from April. Increases were observed across all cities except Oakville and Mississauga where prices fell. The highest increases were in Vaughan and Burlington.
Figure 3. illustrates the number of new apartment listings. New listings have spiked by 52% from April to May 2020 across the GTA.
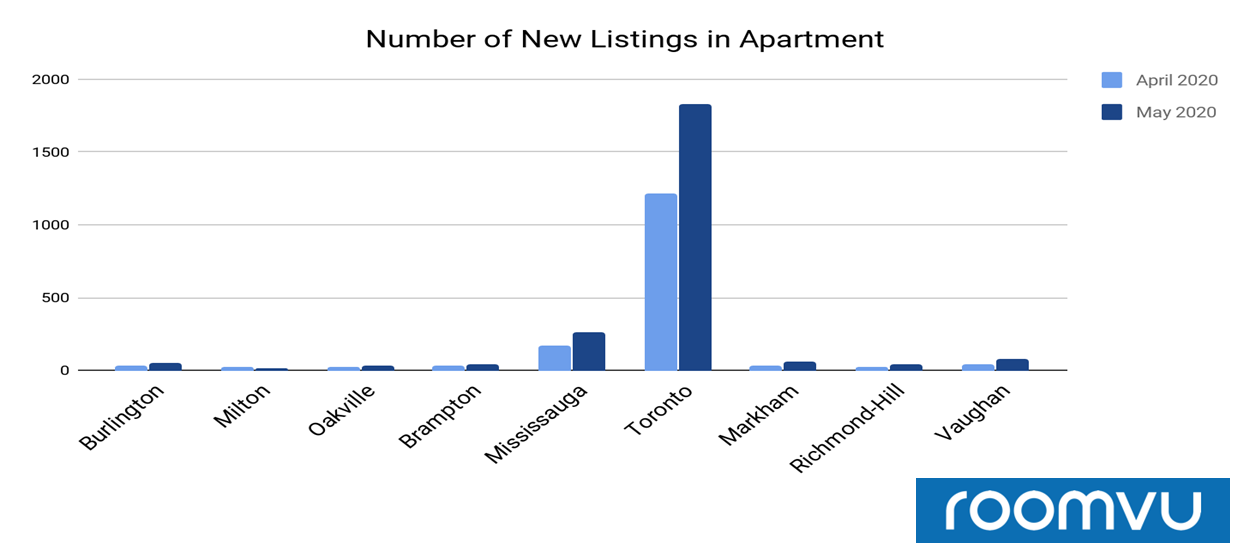
The number of new listings increased across cities except for Milton where there was a 34% drop.
Figure 4. illustrates the number of apartment sales in May. Sales increased in May from April across all cities except Richmond Hill where there was a 19% decline. Highest growth in sales was observed in Mississauga and Burlington.
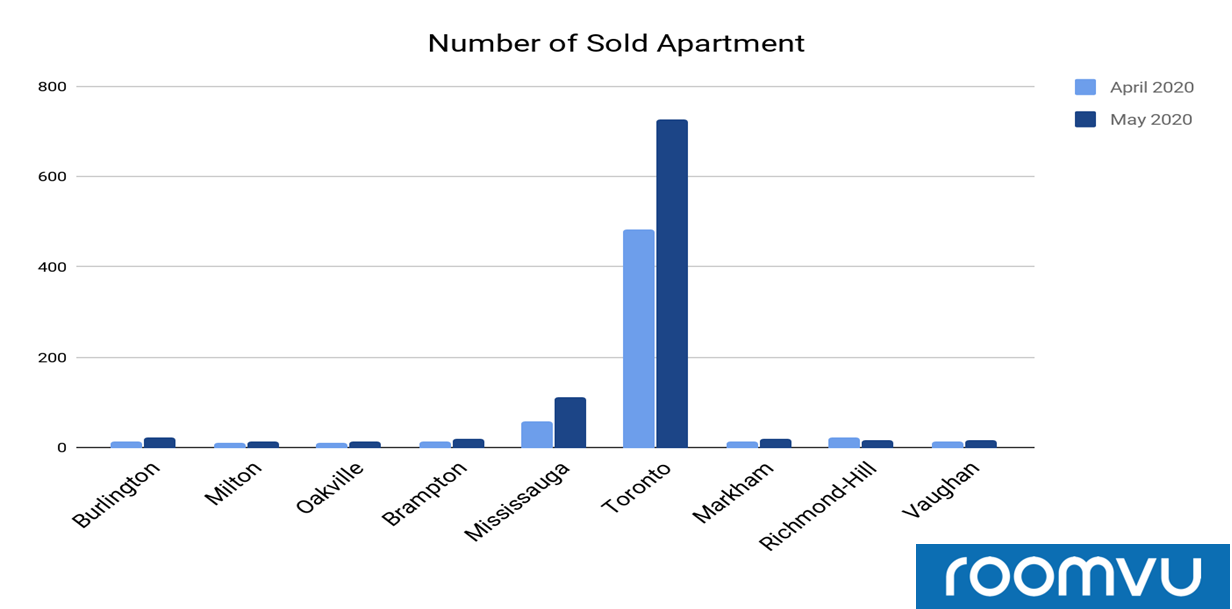
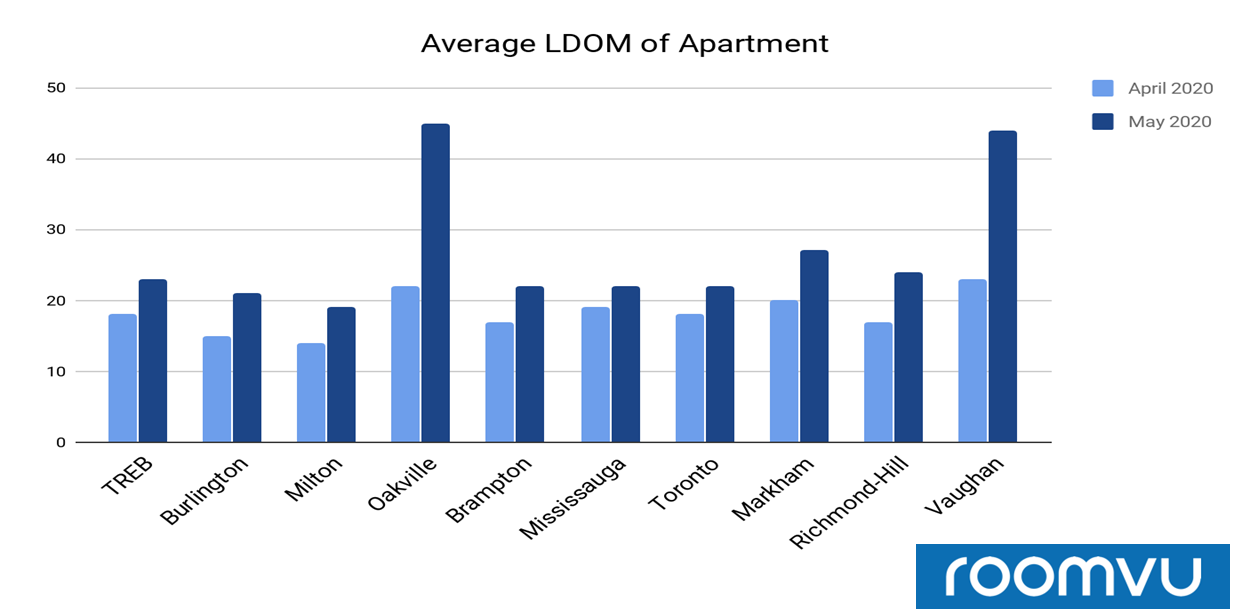
Figure 5. illustrates the average LDOM—the average days the listing remained for sale on the market. The number of days it took for GTA apartments to sell increased by 27% in May compared to April. This could be due to listings in April having been put on the market before COVID-related lockdowns, while those in May were listed during lockdown.
The extraordinary nature of 2020 due to the COVID-19 pandemic has made its mark on detached homes in the GTA. Despite declining numbers in sales of single-family homes and apartments and only modest increases in prices, the May numbers do project some optimism for the market moving forward. As lockdown measures begin to ease, and consumer confidence rebounds, the housing market will gradually return to some kind of normalcy. However, the new normal will likely look different than the old one.