The Best Strategy to Sell Houses in Greater Vancouver
Summary
- Agents should stick within a 14km operation distance for optimal home-sale results.
- Agents should also look at different sub-areas within that 14km radius
For real estate agents, the question of where to choose and activate seems to come up all the time. Arguments for both sides are compelling. Should agents stick with the area they know and specialize, at the risk of being too narrowly focused on one location? Or, should they cover a variety of areas, allowing them to operate in several different areas to hedge against a slowdown.
In collaboration with UBC’s Sauder School of Business, the data science team at Roomvu has discovered a finding that could help agents answer this question and optimize the areas in which they operate. “As the age-old adage goes, ‘don’t put all your eggs in one basket’,” said Thomas Davidoff, professor at UBC’s Sauder School of Business. “We may finally be able to put an end to this age-old question.”
Given the current remarkably turbulent times, results indicate that agents can enhance their performance efficiency by spreading their efforts across different sub-areas within each city in the Greater Vancouver Area.
Main Findings
To explore the relationship between concentration and dispersal of areas in which agents operate and their performance in terms of the total sales volume, the data science team at Roomvu considered two different metrics, which are explained in detail in the Data and Methodology section.
In the first study, agents’ operating area was analyzed at two sub-area and city levels over four years and defined as an index called HHI-score (which is defined later in the article) to evaluate performance. The higher the score, the more diverse an agent’s covering areas was.
As evidenced in Figure 1, the graph of HHI at the sub-area level and agents’ performance in terms of the annual total sales shows a clear positive relationship. More successful agents who generated higher sales (regardless of whether they sell more houses) seem to be more spread-out and operate over multiple areas. This preliminary result indicates a negative return to specialization as agents who are diversifying over multiple areas appear to be more successful than agents who are specialized over certain sub-areas.
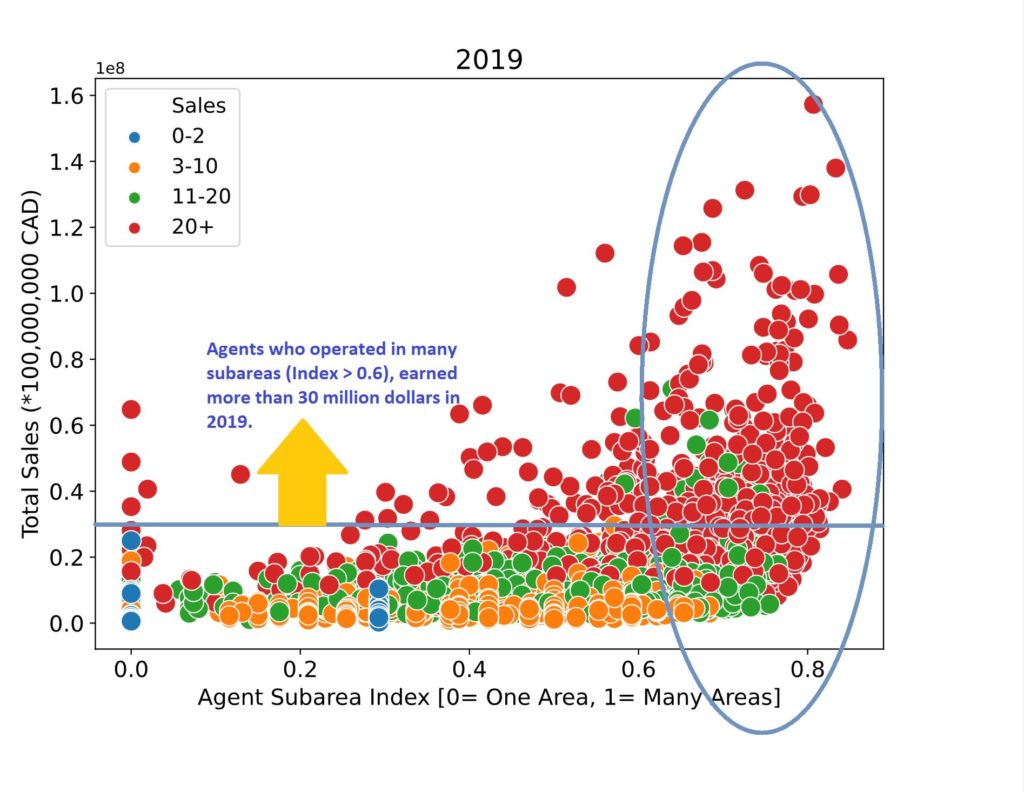
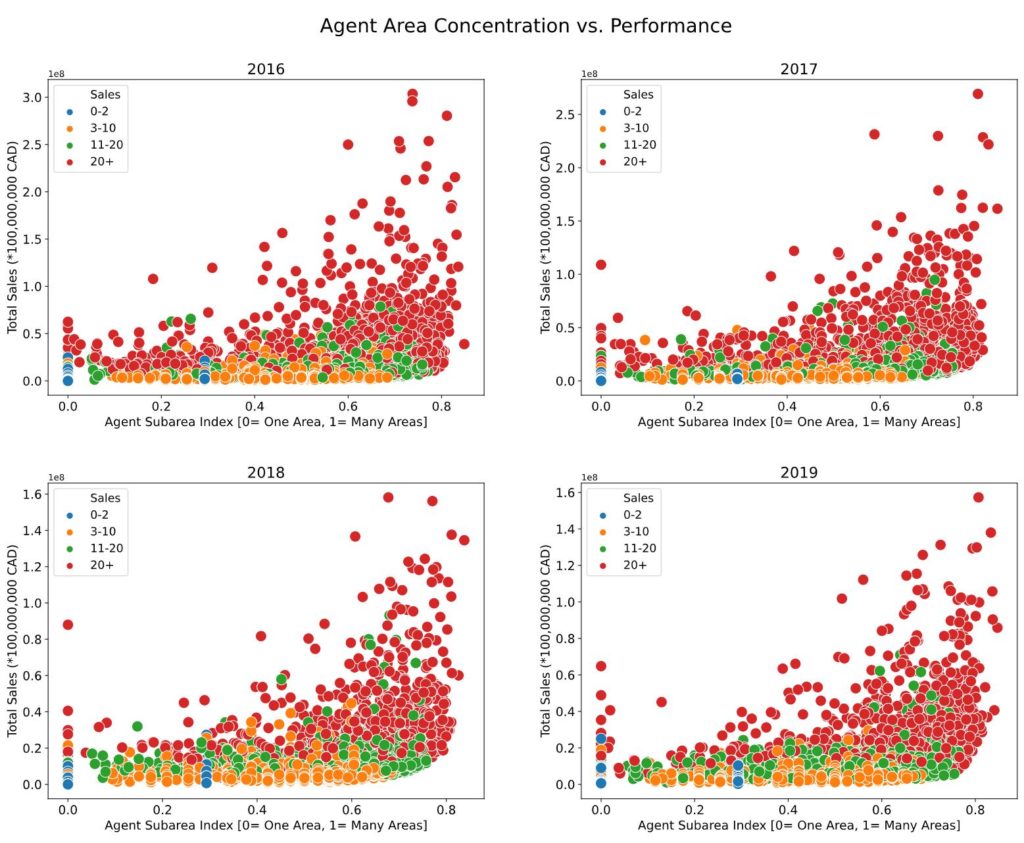
Figure 2 compares agent performance with respect to sub-area level index in 2016, 2017, 2018, and 2019.
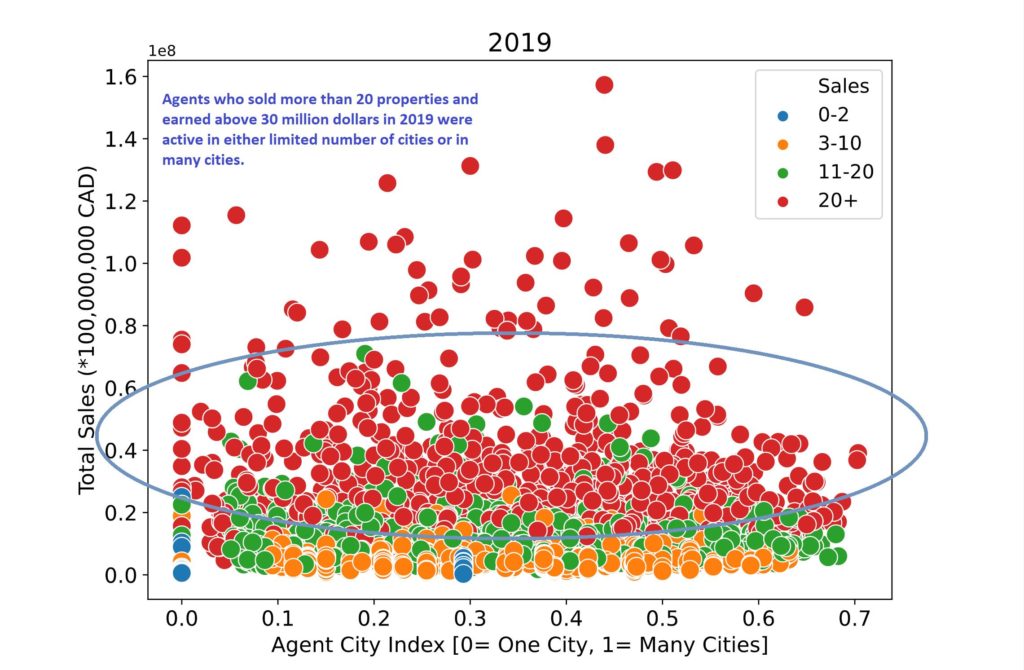
However, creating the same plot with HHI-score at the city level did not quite show the same effect, as it can be clearly seen that agents who are exceptionally successful could actually be very concentrated or diverse at the city level.
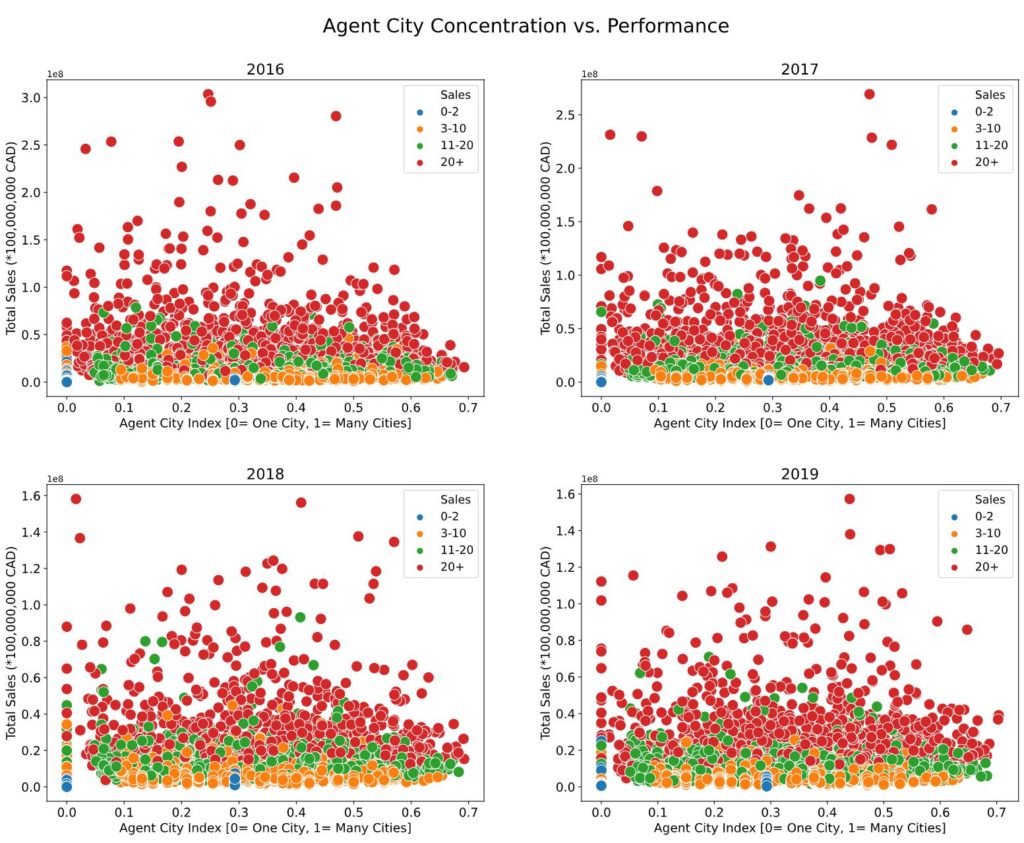
Figure 3 illustrates the results by city-level within the Greater Vancouver Area. Similar dispersion is observed across multiple years where successful real estate agents can either be specialized or diversified across cities, as depicted by Figure 4.
Nevertheless, it is noteworthy that agents achieving high numbers of sales might tend to operate across many subareas, but also could be concentrated within a specific city.
In the second study, the Roomvu data team determined agents’ performance using a different metric based on the average distance from each property sold by an agent from the center of his/her area of operation. The plot of distance index and performance showed a stark opposite result compared to the HHI concentration (which showed no correlation at city-level and positive correlation with low concentration at sub-area level) as represented in Figure 5.
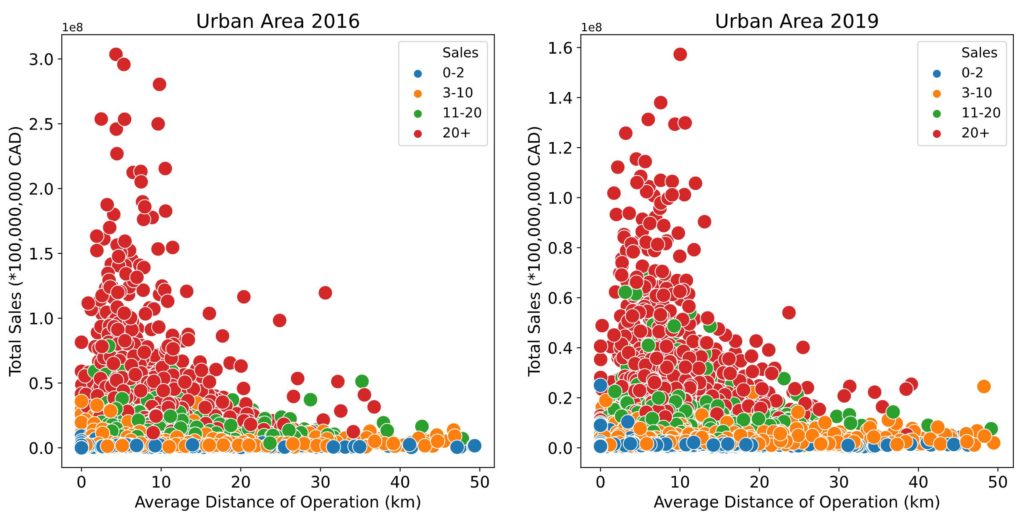
Furthermore, as seen in Figure 2, from 2016 to 2019, agents recorded the highest sales volume in 2016. As a baseline, the concentration for the best-performing agents in 2019 was compared to 2016 in Figure 6, and similar results were obtained in both years.
The optimal operating distance to sell a higher volume of houses (11-20 properties and 20+ properties) and earn more dollars is shown to be clustered in a roughly 12-14 km area (Figure 6).
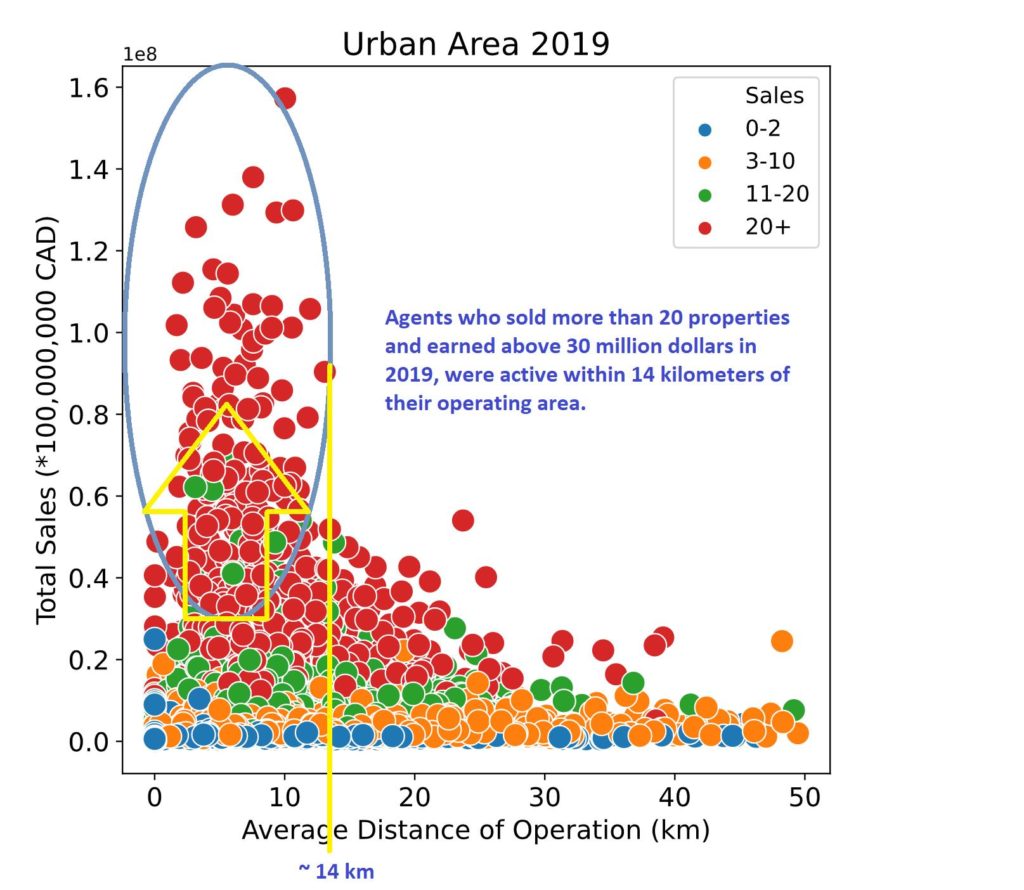
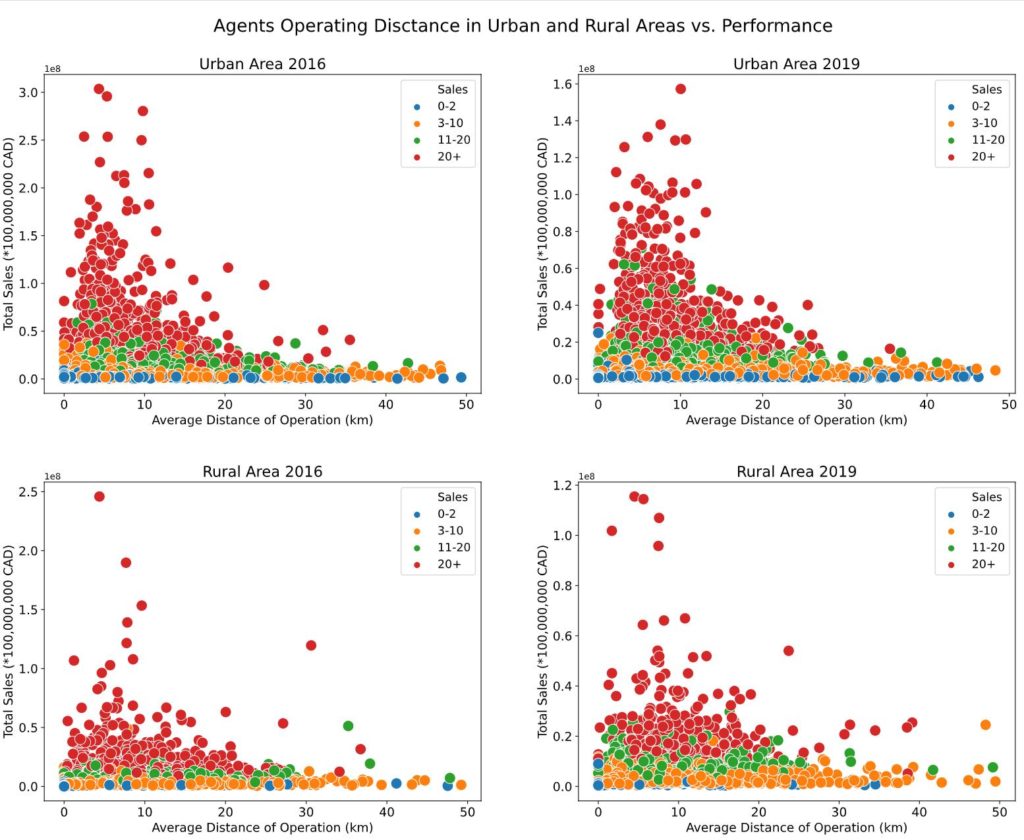
To control for the inherent bias that agents working in urban areas (such as Vancouver) would be generating higher dollar sales within smaller areas, the data team at Roomvu split the plot into agents working in urban and rural areas. Agents who were assigned as urban sold more than half of the properties located in areas considered as urban. Alternatively, they were assigned as rural (an attempt to spread the cut-off level yielded the same analytical result). As before, the pattern persists for both urban and rural agents that the best performing agents only operate with a roughly 14 km cluster base of operation.
*Areas assigned as “urban” include: Vancouver West, Richmond, Burnaby, Vancouver East, Coquitlam, North Vancouver, Maple Ridge, New Westminster, Port Coquitlam, West Vancouver, Delta, Port Moody, Surrey. The remaining areas, most significantly in Chilliwack and Fraser Valley are considered “rural”.*
Putting the distance index through regression analysis (results not shown here) indicated the same result where the distance index was shown to have had a significantly negative effect on agents’ performance; indicating that there is a positive return to specialization that does not fall within a subarea or city boundary.
Ultimately, the results of the various analyses demonstrate the need to walk a fine line between focusing too much on particular sub-areas within a given city, while, at the same time, not stretching out too thin. Agents who achieve this balance will, more often than not, put themselves in a position to succeed.
Data and Methodology
Data were taken from Multiple Listing Service (MLS) of Greater Vancouver Area. In the following, the definition of measures used to capture the concentration levels are described.
1. Herfindahl–Hirschman Index, HHI
To capture the level of concentration within agents’ area of operation, we adapted an alternate concentration index based on the HHI. Since the original HHI is highly non-linear, we reduced non-linearity by taking the square-root of the index. The HHI indexes were defined at sub-area level to capture different scopes of operation. However, there are two main drawbacks of using the HHI approach to calculate levels of agent concentrations.
- Boundary Discontinuity: Concentration does not take into account discontinuity at the area/city boundary. A hypothetical agent that operates at the boundary between two areas may end up with low concentration measures, even if their area of operation is small.
- Similar Difference Weight: The index treats the difference between any pair of areas as equal when in reality selling properties within areas that are located further away may pose a more significant challenge for the agent (and thus, require more effort). For instance, properties in Kitsilano and Point Grey would be more similar and more likely to serve the same market compared to properties in Coquitlam.
To counter the flaw of HHI based approach, we considered an alternate distance-based index that utilizes weighted distance from all the properties sold by the agent.
2. Composite Distance Index
In this sense, distance is being used as a proxy for differences across properties whose sales are facilitated through the agent. The distance index, therefore, measures the level of effort that the agent has to invest in familiarizing themselves with different properties in their portfolio, which represents the cost of diversification.
Due to the current computational constraint, we constructed the index as the average distance from every agent’s center point (The center point is calculated as an average of all the latitude and longitude coordinates of all properties sold by the agent in each year). Agents who only sold one property will have a distance index of zero. In short, the distance function finds the average distance from each property that an agent sold from the center of his/her area of operation.