Sales of Homes 5 Years or Older Have Increased Since Outbreak
Summary
- Sales of older homes (more than 5 years old) have increased in the Great Toronto Area (GTA) since mid-March
- Average price per-square-foot of older attached properties (townhomes and condos) have jumped since March 15
- Sales of detached homes with 3-bedroom and more declined significantly post-Covid. The drastic drop was observed in attached homes with 1- to 3-bedroom.
The economic fallout of the Covid-19 pandemic has been nothing short of extraordinary. Declines in GDP not seen since the Second World War, huge upticks in unemployment, and the closures of many businesses have been but a few of the effects of the global health crisis.
Covid has also dramatically impacted the way we go about our daily lives. Physical distancing restrictions, including limits on the size of gatherings, have altered much of our behaviour and preferences. What’s more, working from home has become more common than ever.
“We see anecdotal results in the Greater Toronto Area indicating a fly-away from quality. In the GTA, people are moving away from quality and moving towards affordability”, commented Thomas Davidoff, professor at UBC’s Sauder School of Business. “That would be consistent with an urgency to own a household during the coronavirus crisis,” he added.
“We have seen a great shift in terms of how people shop for homes during the pandemic, newer luxury homes are sitting in the market for a lot longer now, whereas more affordable homes are still in high demand due to their price point, the same trend can be seen in Vancouver and Calgary” said Sam Mehrbod, a Realtor and CEO at roomvu.
The real estate market in Canada has experienced mixed results as a result of the pandemic. Record-low interest rates and an oversupply of buyers versus sellers have helped push the average Canadian home price to record levels. According to a new report, it’s also affected the type of home that homebuyers in the GTA are buying.
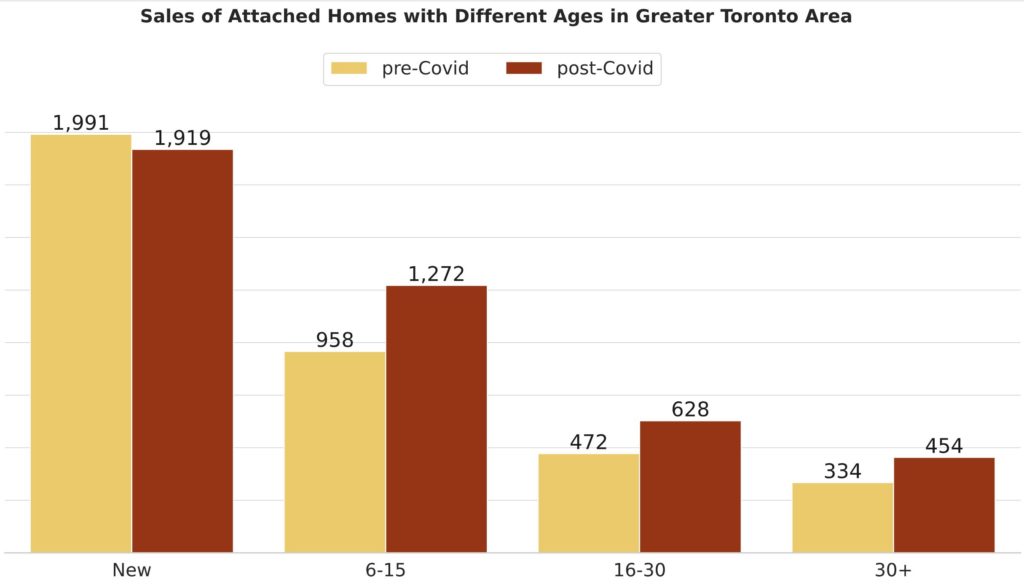
The report, compiled by real estate marketing and analytics company Roomvu, looked at prices of attached homes sold through the first seven months of 2020, further separating the data into the pre-outbreak period (January 1 to March 15) and post-outbreak (March 15-July 30). To deepen the analysis, the report looked at sales of homes based on the age of the home, separating out “new homes” (0-5 years old), and homes that were 6-15 years old, 16-30, and 30 or more, respectively.
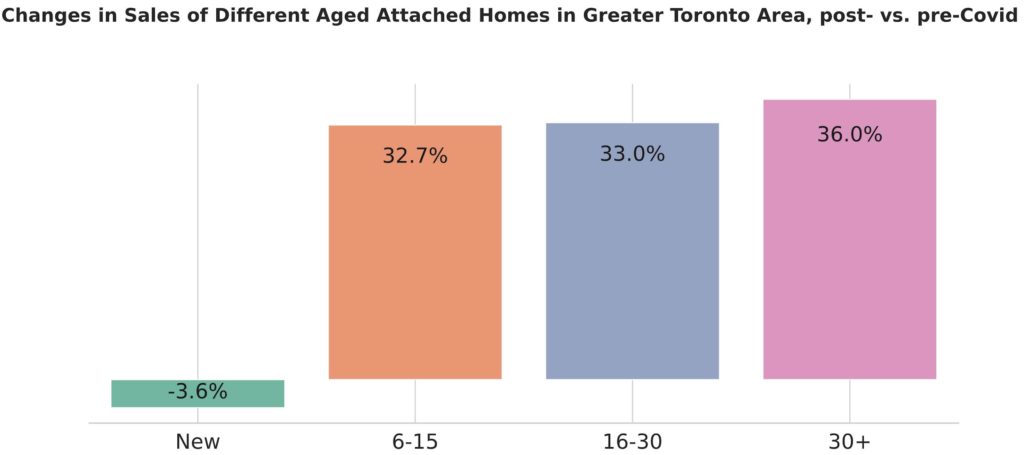
Comparing both pre- and post-Covid periods in Figures 1 and 2, the data showed that while sales of new homes (0-5 years old) stayed more or less the same — dropping by just 3.6% — sales of homes aged five years or older increased by more than 32%. Increases also occurred with respect to homes between 6-15 years old (33%) and those 30 years or older (36%). Some experts see this trend as a shift reflective of the current economic uncertainty.
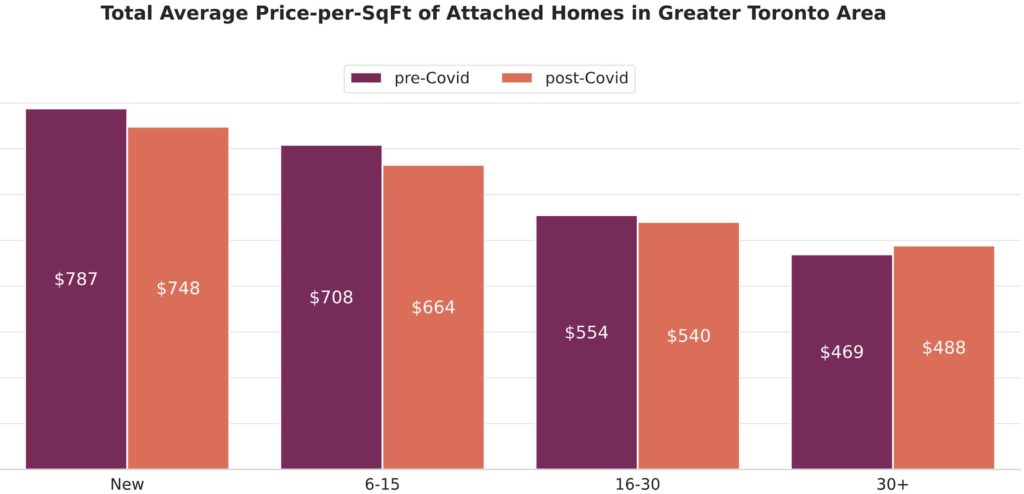
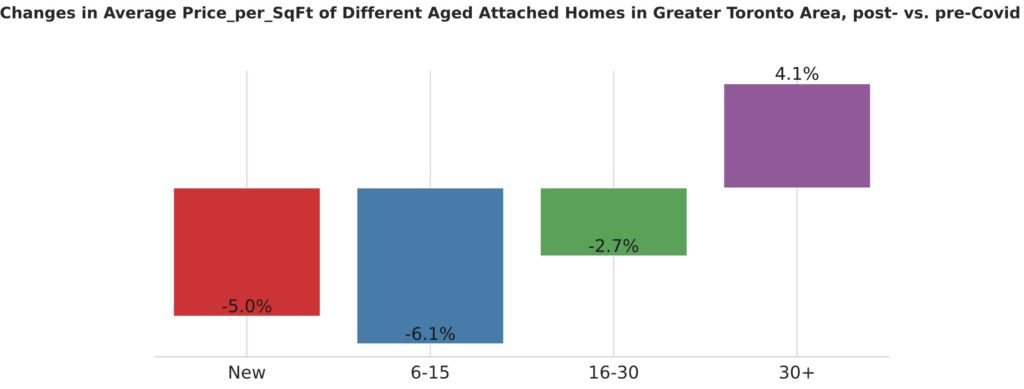
As Figure 3 depicts, on a price per square-foot basis, the oldest homes (30+ years) in the GTA are seeing prices increase, while prices have slightly fallen among homes in the other age categories. This could be indicative of the increased demand for homes of this age. Homes between 6-15 years old experienced the highest percentage drop in prices at just over 6%, with new homes dropping by 5%, according to Figure 4.
Given the relative unpredictability of the housing market in the GTA and across Canada, it may be difficult to draw any sweeping conclusions from the data presented in the report. Some analysts predict that home prices will remain at current levels into the fall and for the rest of the year. Those same analysts predict that prices will fall in 2021. The long term outlook notwithstanding, buyers’ shift towards older homes in the GTA is noteworthy for the time being.
Other Observations
Furthermore, Roomvu analyzed the sales and average price data of detached and attached properties in pre- and post-outbreak. Listings were categorized into bachelor suites and 1- to 3-bedroom and greater than 3-bedroom homes.
Detached Homes
More than 10,100 detached homes were sold in the first seven months of 2020. Figure 5 breaks down the number of sales based on the number of bedrooms and compares the sales in those two spans of time. The sales during post-Covid was lower compared to March 15th backwards.
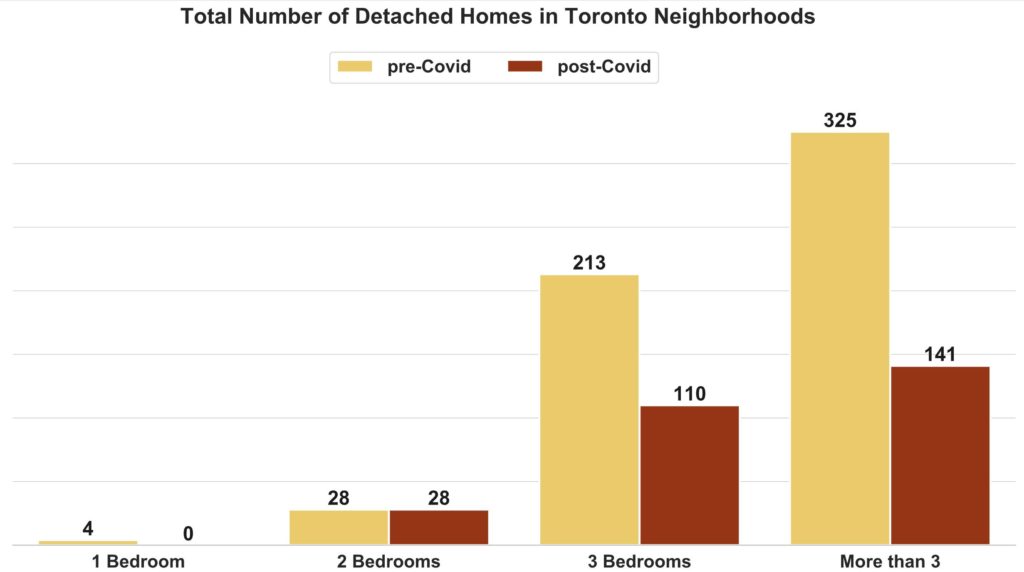
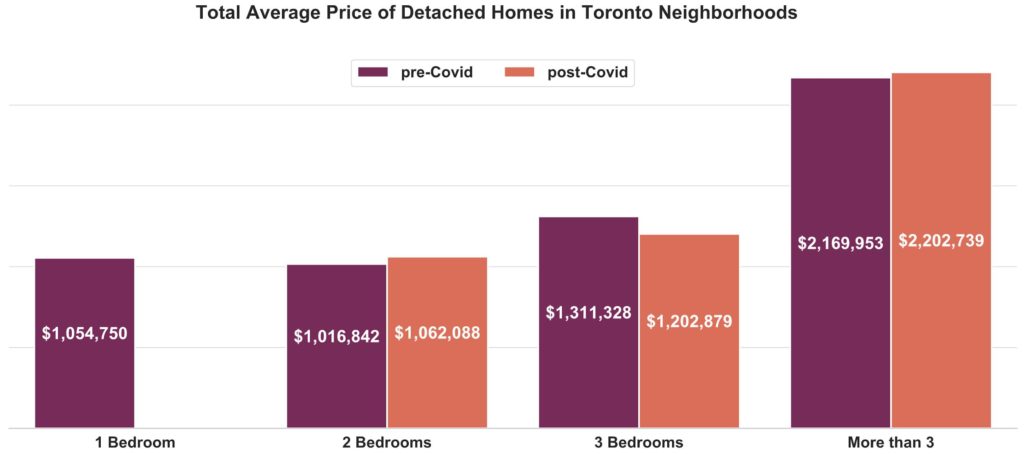
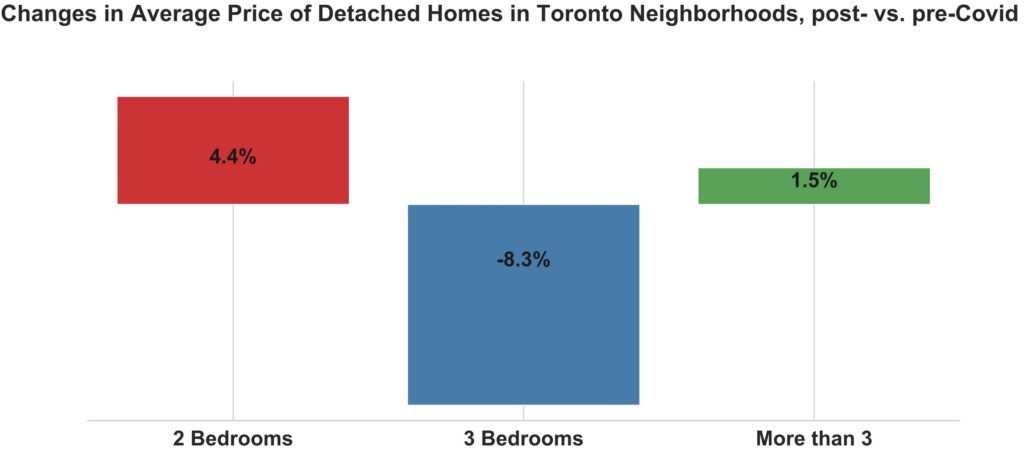
Figure 6 shows the average sold price of different detached properties. While there was no 1-bedroom apartment sold during post-Covid, the prices for 3-bedroom homes dropped whereas for the others rose, according to Figure 7.
Attached Homes
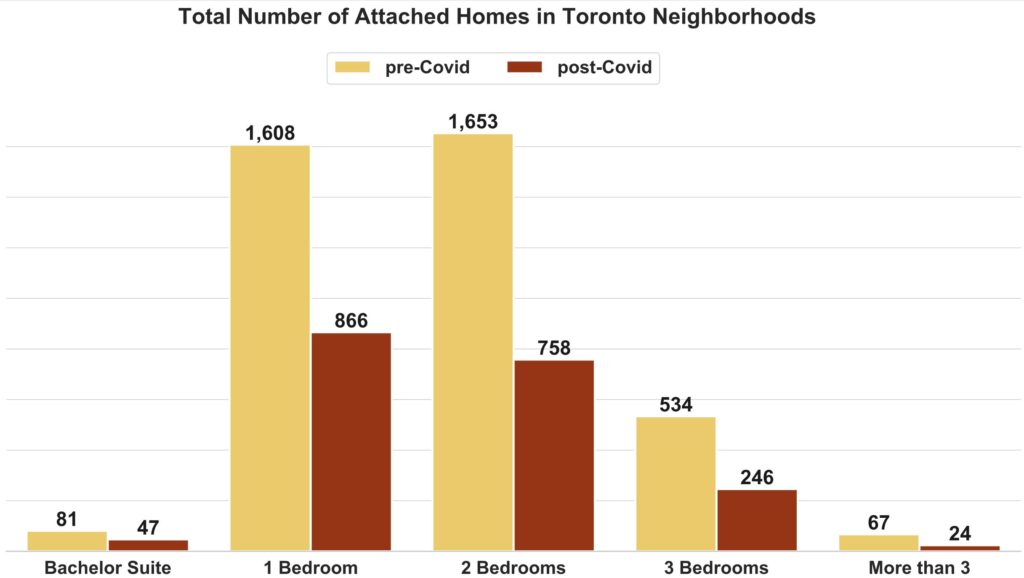
More than 3,900 attached properties were sold in pre-Covid and almost 1,950 in post-Covid. While Figure 8 compares the number of sales in pre- and post-pandemic periods, Figure 9 depicts prices for these spans of time.
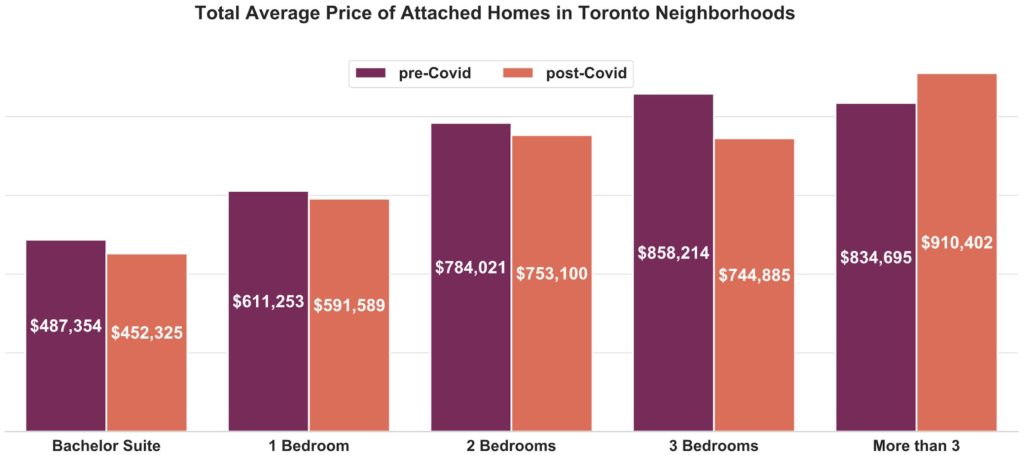
For all numbers of bedrooms prices dropped except big homes with more than 3-bedroom where prices raised 9%.
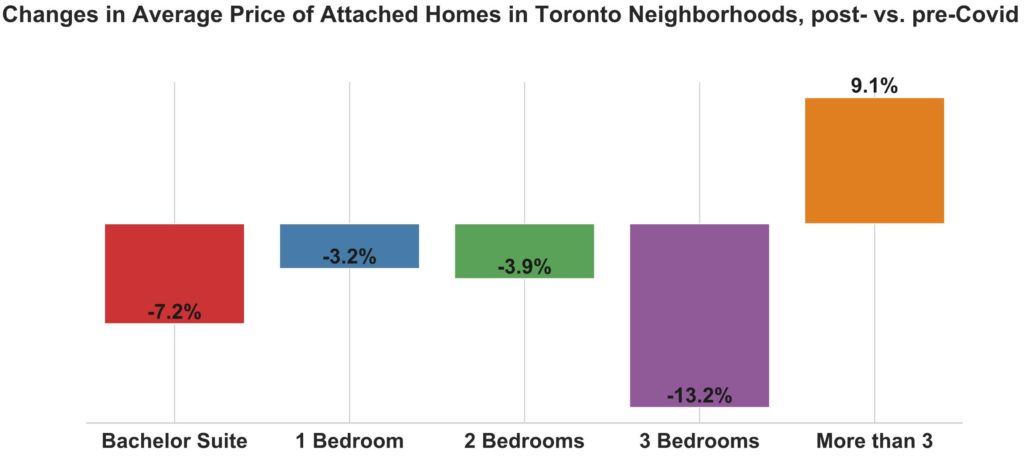
The average price of big homes with more than 3-bedroom rose in both detached and attached home types while the price dropped for 3-bedroom properties. Detached 2-bedroom homes experienced a price increase in post-pandemic; however, the average price for these homes and also smaller ones in attached type declined.
Methodology
Roomvu analyzed data from the Toronto Regional Real Estate Board Multiple Listing Service (MLS) for the year of 2020. To ensure that the number of sales before and after the emergence of pandemic is close, the data was limited up to the end of July 2020. Additionally, to control for the size of the properties, price per square-foot metric was chosen.