Summary
- The number of new listings increased 29.2 % in May from April suggesting sellers are returning to the market.
- Sold prices dropped between 3-4% in May from April.
- All counties experienced a drop in sales in May 2020 versus May 2019; but sales increased in all but King County from April to May 2020.
- Lower sales prices YoY were observed in King County, with prices higher in all other counties. This suggests buyers are becoming more attracted to less populated suburbs.
- Luxury home sales have declined due to COVID-related response measures, perhaps related to an increase in working from home and plans to buy homes further from city centers.
Despite the severe economic downturn stemming from the coronavirus pandemic, Northwest MLS member-brokers reported impressive improvements on key indicators from April to May 2020. The volume of new listings, including single-family homes and condominiums, rose 29.2%, and pending sales jumped more than 44%.
Figure 1. shows median prices across all properties in King County for May 2019 and May 2020. Prices dropped by 2.79% on average.
“I don’t think anyone should be surprised that home prices in King County took a ‘breather’ in May,” said Matthew Gardner, chief economist at Windermere Real Estate. “Clearly COVID-19 was the cause for this drop, but I’m confident this is a temporary situation that will be reversed as King County starts to reopen, and fresher inventory comes to market.”
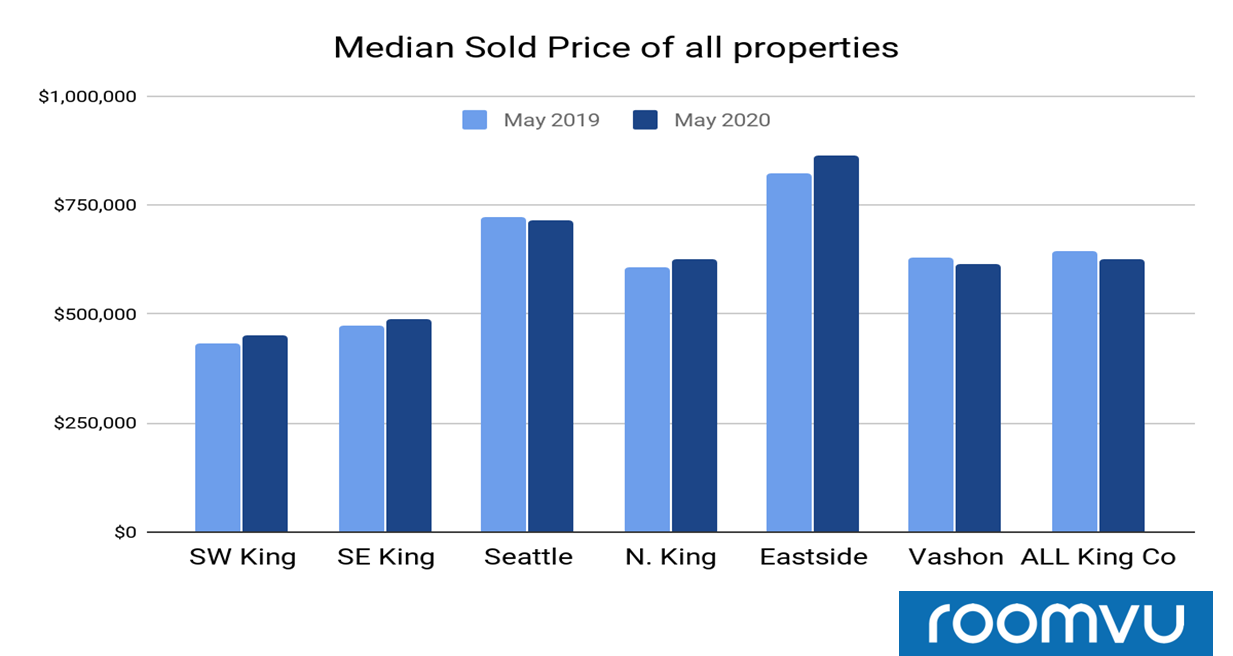
Some areas within King County experienced a rise in prices. The areas with the highest surge in YoY median prices were Eastside (4.92%) followed by SW king (4.37%). Properties in Seattle experienced a slight decline of 0.97% in median prices.
Figure 2. shows the percentage change in sales of luxury homes ($2M+) in King County for May 2019 versus May 2020. Grady also commented on the slight price drop in King County, saying he believes it’s a reflection of reduced activity in the luxury home market, which disproportionately impacts overall price averages. “This may be a reflection of a ‘wait and see’ attitude or just the uncertain times we’re in.”
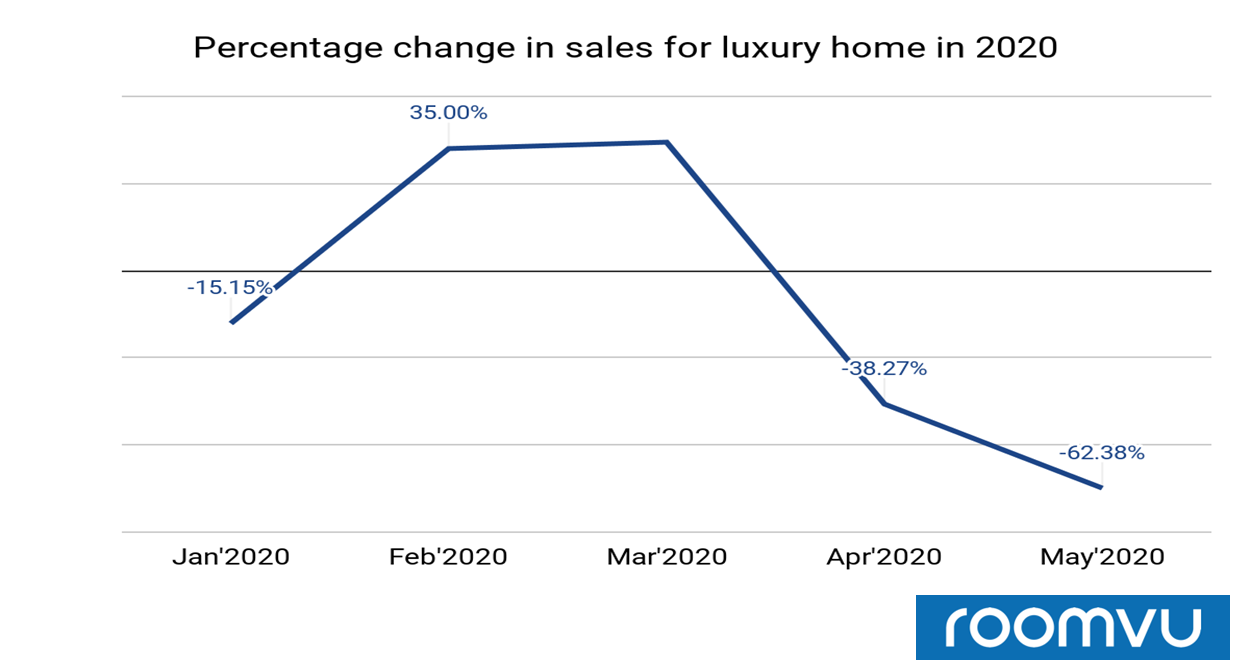
Figure 3. shows median prices across single-family homes in King County for May 2019 and May 2020. The median prices of all properties dropped 4% in King County.
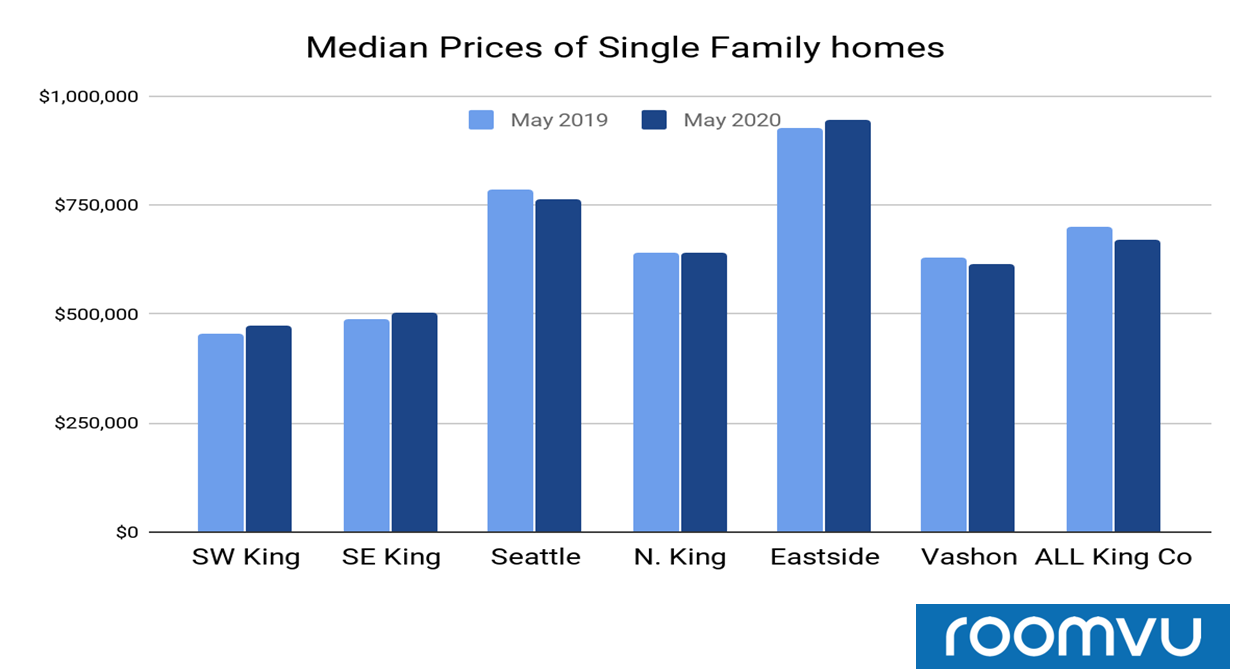
Although prices in King County have decreased, some areas have actually seen an increase in YoY median prices for single-family homes: SW King (4.40%) and SE King (3.06%).
Figure 4. shows median prices across condos in King County for May 2019 and May 2020. The median condo price dropped 2.33% in King County.
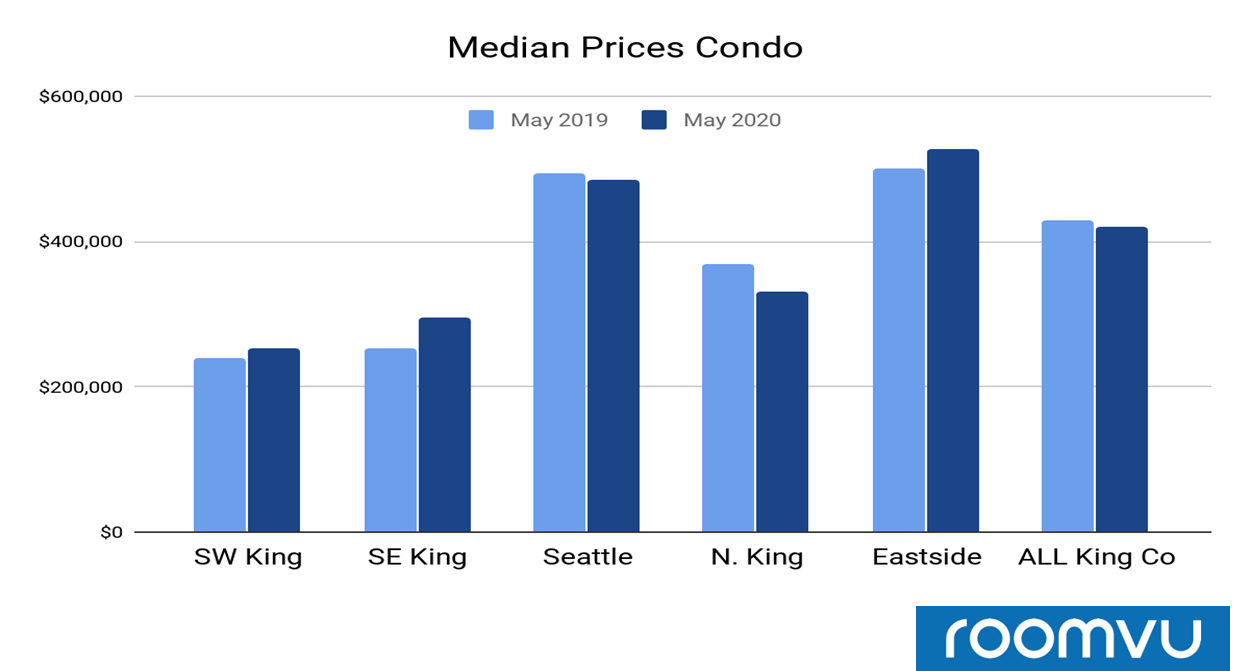
The few areas in King County experiencing a gain in prices are SE king (16.14%), SW King (5.99%) and Eastside (5.61%).
Figure 5. shows the number of sales across different counties for May 2019 and May 2020. According to the NWMLS report, its members completed 5,957 transactions in May, a slight improvement from April’s total of 5,866. When compared to a year ago, however, the number of closed sales (9,153) represented a decline of about 35%.
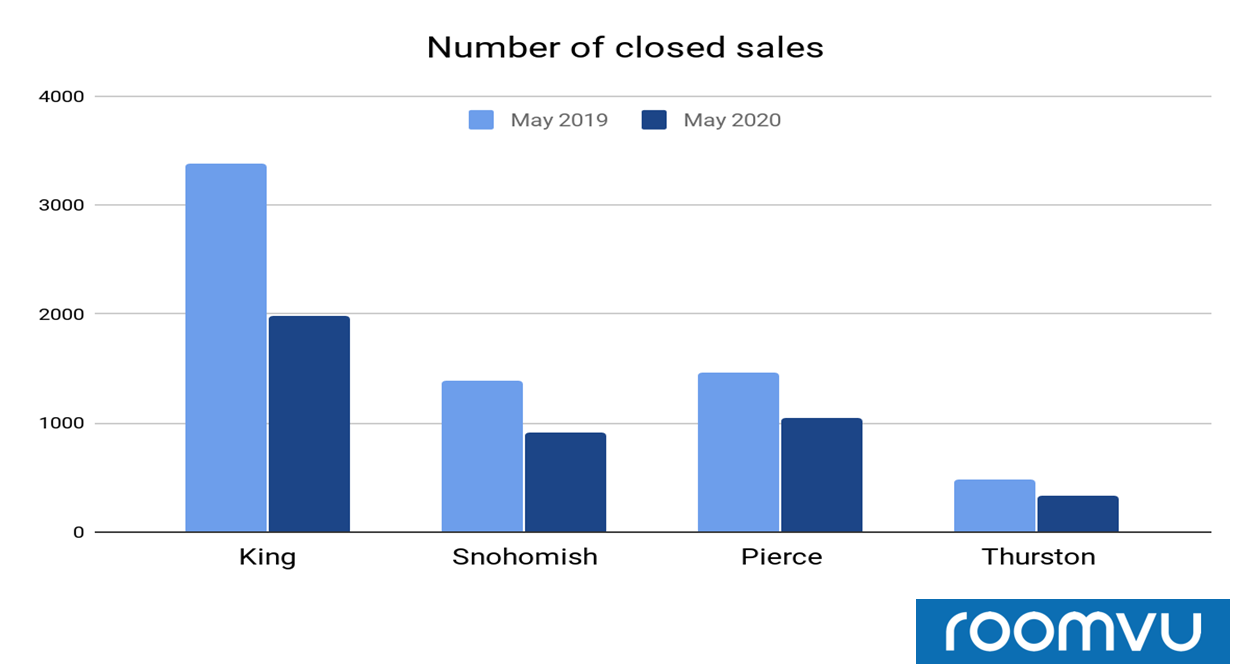
From the above graph, we can observe that King county experienced a dramatic drop of 41% YoY and 4% from April 2020. Even though a drop in sales was observed in other counties when compared to May 2019, they are experiencing a rise in sales when compared to April 2020.
Figure 6. shows the median prices of sold properties across different counties for May 2019 and May 2020. According to the NWMLS report, the median price of closed sales was $449,950 across the NWMLS coverage area. That compares to the year-ago figure of $440,000, an increase of about 2.3%. Okanogan County had the highest increase in median prices—20.3% YoY.
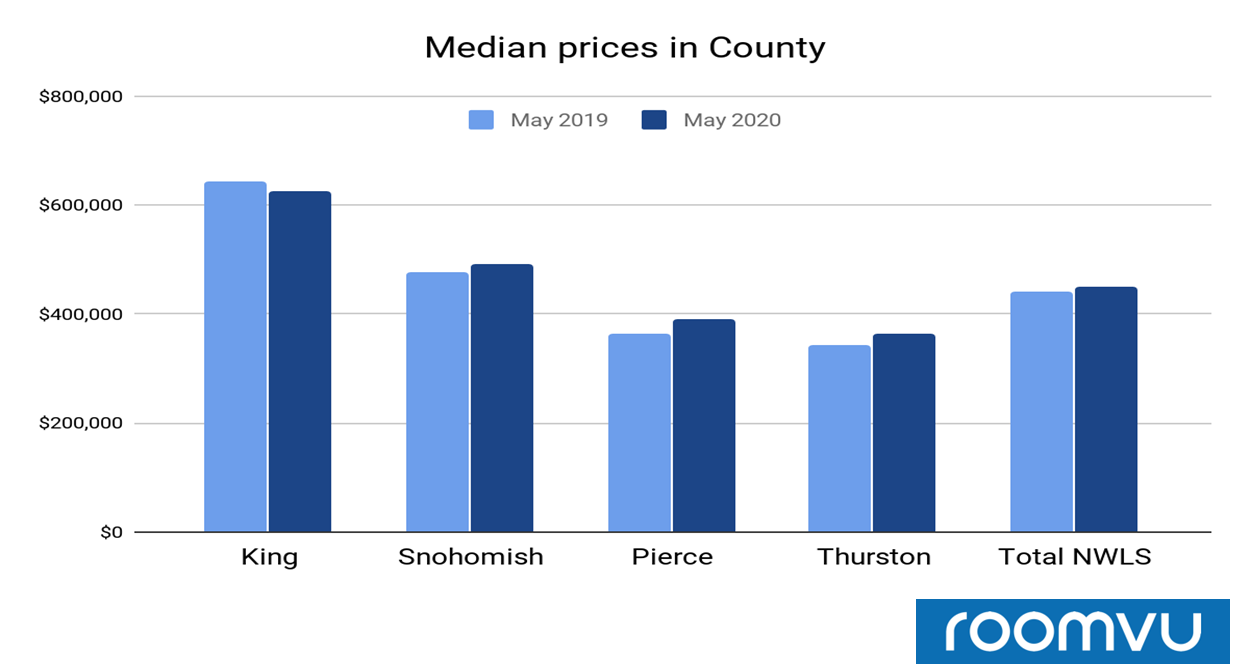
We can observe from the above graph that, excluding King County, all counties have experienced a gain in median prices when May 2020 is compared with May 2019. This could be a sign of more demand for smaller cities and suburbs after COVID-19 and less demand for populated cities.
Dean Rebhuhn, owner of Village Homes and Properties in Woodinville said “The pandemic may be causing buyers to move farther out, wanting to get some space and a useable yard.” Amenities such as parks and trails are also important in current homebuying decisions, he added.
Ultimately, the full-extent of COVID-related economic impacts have yet to be fully realized. The real estate market has been directly impacted by prospective buyers’ disinclination to purchase properties. But month-to-month improvements from April to May 2020 are cause for cautious optimism. While a return to normalcy is still a long way off, and the new normal will look different than it did pre-outbreak, market experts are confident that things are trending in the right direction.