Summary:
- The median sold price of detached homes in Metro Vancouver dropped 3% from pre-COVID (Jan 1 – Mar 15) to post-COVID (Mar 16 – May 31); but increased by 0.3% since April
- A decline in median assessed value and average size of detached homes from pre- to post COVID suggests buyers’ are showing a preference for low priced properties.
- Detached homes in Richmond and Burnaby are experiencing the biggest percentage gains in sold price over assessed value.
- The median sold price of apartments has dropped 3.7% from pre- to post COVID; 0.3% since April
- Decline in assessed value of apartments sold indicates buyers’ appetite for lower-priced apartments
- Two-bedroom apartments are becoming increasingly popular during post-COVID and have a higher percentage increase of sold price to assessed value.
- The sale of apartments has dropped by 47.6% YoY and 59% from pre- to post-COVID.
Comments and Methodology
Slow sales activity is a warning sign, according to Thomas Davidoff, economist and professor at UBC’s Sauder School of Business. “Low transaction volumes typically lead to low prices; however, it appears that sellers and buyers have disappeared from the market in similar proportions. Conditions in the market appear to have changed less than one might have expected before and after the shut down,” says Davidoff. “We continue to see a very strong relationship between price point and sales performance, both in terms of sales to listings and price relative to assessment.”
Davidoff points out that sales on the lower-end of the price-range are showing stronger sales performance than higher-priced properties.
“There are difficulties when comparing pre- and post-COVID-19 average or median sale prices,” explains Sam Mehrbod, a local Realtor and Roomvu’s CEO. “Average or median prices can quickly become skewed based on outliers, while prices require ongoing trends to provide meaningful data,” he added.
For these reasons, our researchers examined pre-COVID-19 sales prices relative to property assessment values and compared this to post-COVID-19 sales prices related to property assessment values.
“Assessment values rise and fall based on a variety of characteristics: sub-area trends, renovations, property attributes and market conditions, among others. Assessing the difference between sales price and assessed value can represent an excellent measure of a market’s activity,” says Sam Mehrbod.
To determine the impact of COVID-19, Roomvu examined sale prices and assessment values before March 15, 2020 and after March 15, 2020 for detached homes in Greater Vancouver municipal markets.
Detached Homes
In its May report, the Real Estate Board of Greater Vancouver (REBGV) says home prices have remained steady. It also noted that buyers and sellers are becoming more comfortable participating in the market. The median sold price for detached homes in Greater Vancouver (GV) for May, 2020 was $1,456,700—a 2.9% increase from the previous year.
Figure 1. shows the median sold price of detached homes in nine select GV municipalities. The data shows that median sold prices have dropped in these cities between March 16 and May 31.
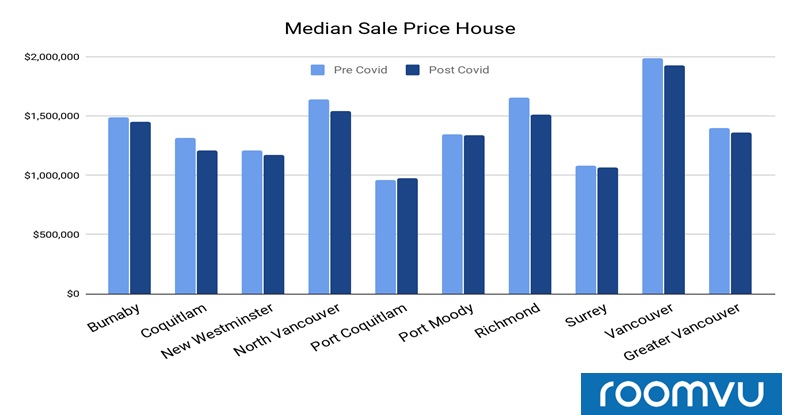
Although the median prices have increased slightly since April (0.3% increase according to REBGV report), prices for detached homes post-COVID are still lower than the pre-COVID—as can be seen in the diagram. Median sold prices dropped by 3% overall in Greater Vancouver.
Cities like Coquitlam, North Vancouver, and Richmond are experiencing the highest drop in median sold price pre- to post-COVID.
Figure 2. shows government assessed value of detached homes across different cities. Government data indicates the assessed value of sold detached homes has dropped pre- to post COVID, suggesting a tendency for buyers to seek lower-priced detached homes.
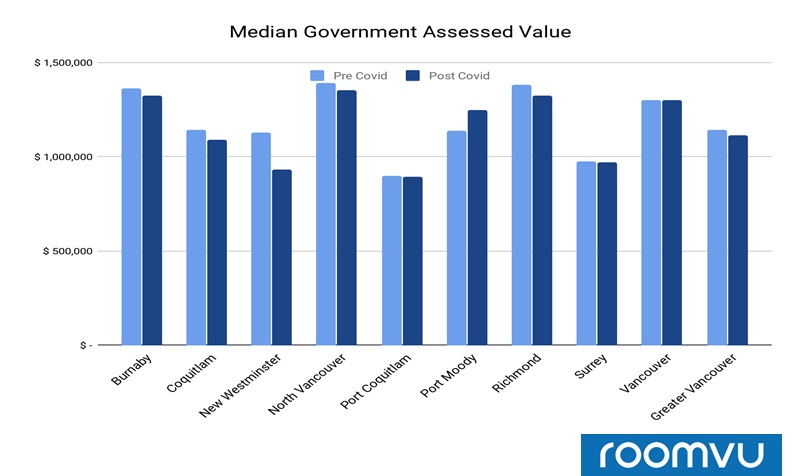
In Greater Vancouver, government assessed values of sold detached homes declined by 2.5% pre- to post-COVID, again suggesting a buyer preference for lower assessed home values. Assessed prices for sold homes across most GV municipalities were stable or dropped slightly—only in Port Moody did prices rise.
Figure 3. compares sold prices with government assessed values for all properties sold pre- and post-COVID. Data from seven GV municipalities, as well as the average for the entire GV region are included.
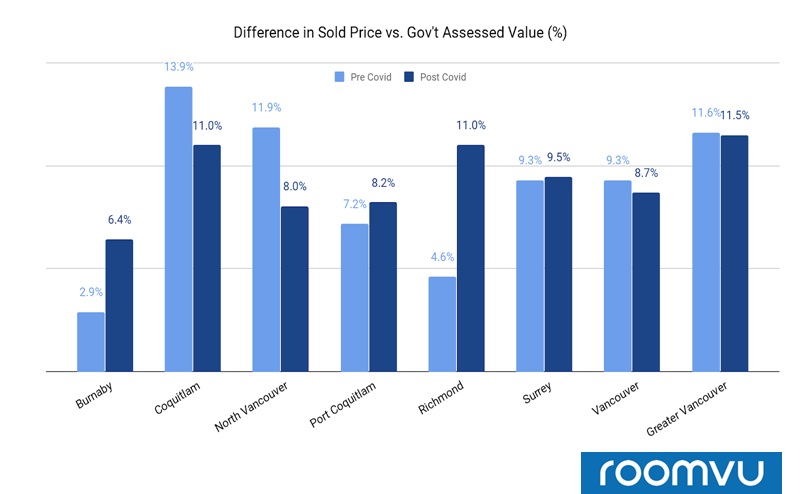
The impact of COVID-19 has not been uniform across the Greater Vancouver region:
- Detached homes in Richmond and Burnaby are experiencing the biggest percentage gains in sold price over government assessed value—sellers in these municipalities might consider listing their properties soon, given the strength of the market;
- Detached homes in North Vancouver and Coquitlam experienced the biggest percentage drop (2-4%) in sold price over government assessed value;
- Percentage of sold price to government assessed value for detached homes in Vancouver and Surrey has remained stable pre- and post-COVID.
Figure 4. compares the number of sales of detached homes pre-and post-COVID to further gauge the pandemic’s impact on sales.
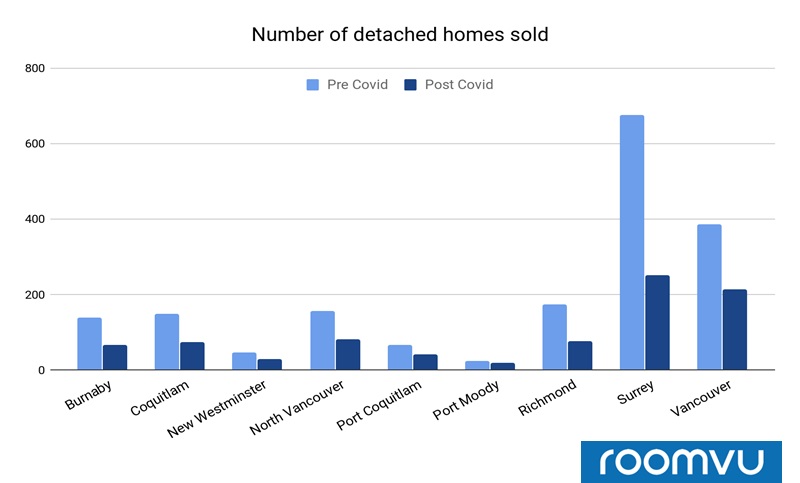
According to the REBGV report, sales of detached homes have decreased by 41.5% YoY in Greater Vancouver. A similar decline in detached home sales was observed pre- and post- COVID: sales declined by 49% in Greater Vancouver between Jan 01 and May 31, 2020. Sales have declined across most cities—the worst-hit being Surrey, Burnaby, and Richmond.
Figure 5. compares mean home area in SqFt in detached homes purchased pre- and post-COVID in nine municipalities across Greater Vancouver, as well as the average for the entire region.
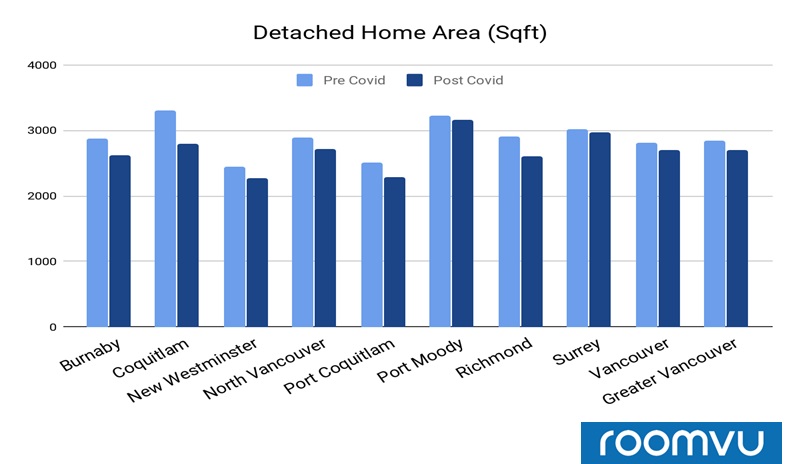
The mean area of detached homes purchased in Greater Vancouver has dropped by 5.5% pre- to post-COVID. The decline in home area is highest in Port Coquitlam and Coquitlam.
APARTMENTS AND CONDOS
In the May 2020 edition of the REBGV monthly report, apartment prices in Greater Vancouver (GV) were shown to have remained steady, with buyers and sellers becoming more comfortable participating in the real estate market. The median sold price for apartments in Greater Vancouver in May 2020 was $686,500—a 3% increase over the previous year.
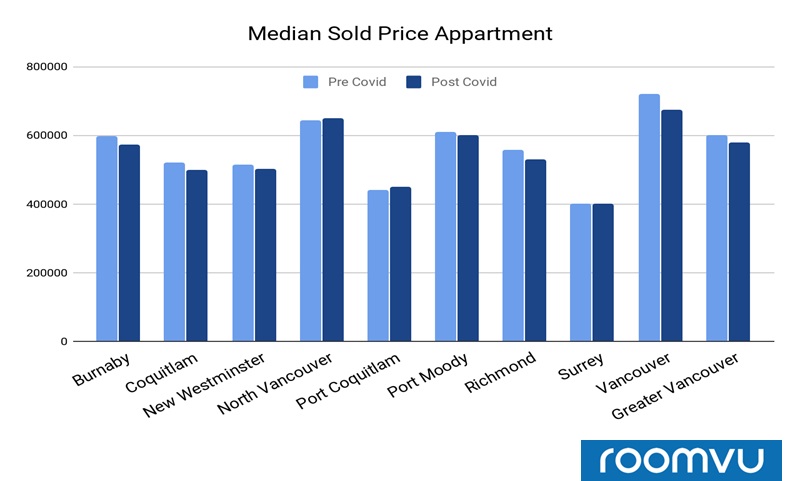
According to the REBGV monthly report, the mean sold price for apartments decreased by 0.3% since April 2020. A 3.7% decline in median sold prices of apartments was observed pre- to post-COVID
In addition, to mean sold prices, the REBGV report looks at changes in government assessed values pre- and post-COVID. Figure 2. illustrates this comparison by examining data from nine different municipalities across the GV region.
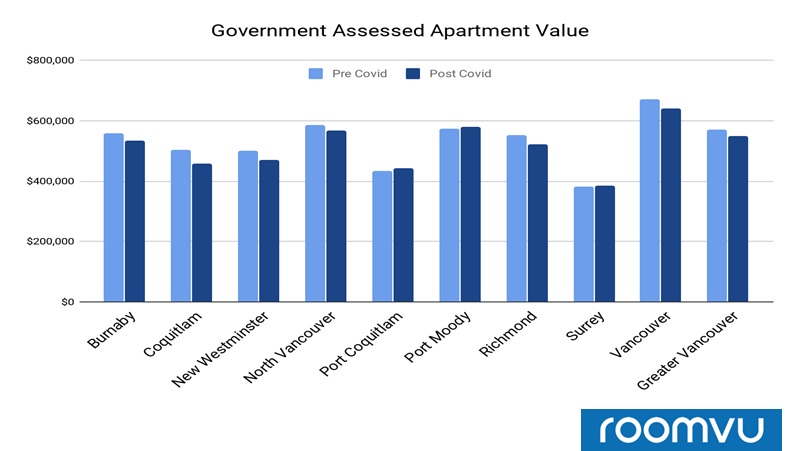
Government assessed values of sold properties have declined across all municipalities except Port Coquitlam and Port Moody. In Greater Vancouver, the assessed value of property declined by 4% pre- to post-COVID. This suggests buyers are more inclined towards apartments with lower-assessed values.
Figure 3 compares the change in sold price with government assessed values for all properties in GV sold pre-and post-COVID. Nine different municipalities are featured in the Figure, as well as the average price for the entire region.
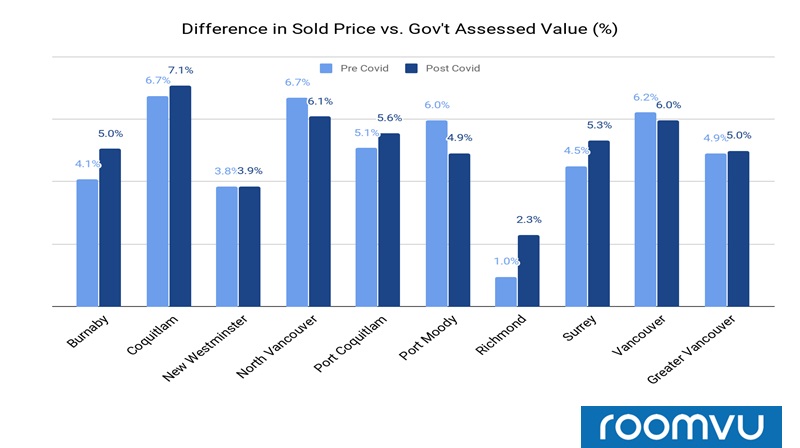
Gains in sold price over assessed price have remained stable for the apartments in Greater Vancouver pre- and post-COVID. Although the impact of COVID on sold price has been different in different municipalities:
- Apartments in Burnaby, Surrey, Richmond are experiencing the biggest percentage gains in sold price over assessed value;
- Apartments in North Vancouver and Port Moody have the small percentage drop in sold price over assessed value;
- The percentage of sold price to assessed value for the apartments in Greater Vancouver has remained stable pre- and post-COVID.
Data regarding apartments with one and two bedrooms respectively were examined to further comprehend COVID’s impact on Greater Vancouver’s real estate market. Figure 4. Illustrates the percent change in sold price versus government assessed price for one-bedroom apartments pre- and post-COVID.
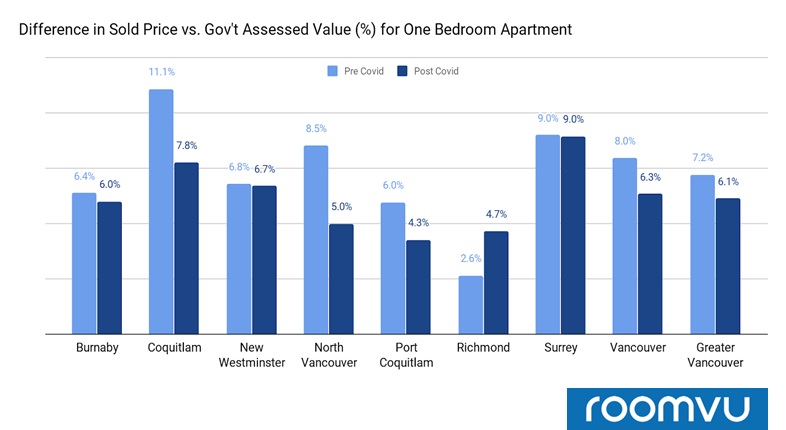
The impact of COVID has not been uniform across the Greater Vancouver region for one-bedroom apartments
- One-bedroom apartments in Richmond are experiencing the biggest percentage gains in sold price over assessed value.
- One-bedroom apartments in North Vancouver and Coquitlam have experienced the smallest percentage drop in sold price over assessed value.
- The percentage of sold price to assessed value for the apartments in Greater Vancouver has remained stable pre and post-COVID.
Figure 5 compares changes in sold price over government assessed price for a one-bedroom apartments pre- and post-COVID.
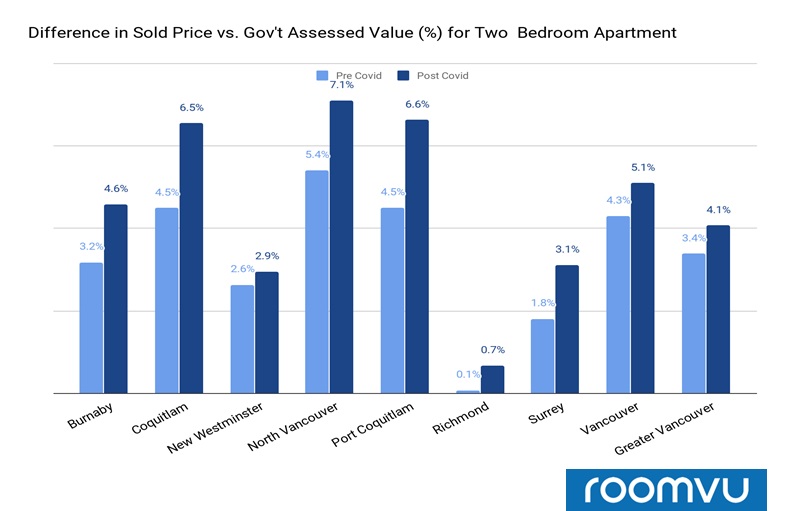
The impact of COVID on two-bedroom apartments has varied among Greater Vancouver municipalities. The popularity of two-bedroom apartments seems to have risen post-COVID, as the majority of municipalities have seen a percentage gain in sold price as compared with assessed value.
- Two-bedroom apartments in Coquitlam, Port Coquitlam, and Burnaby are experiencing the biggest percentage gains in sold price over assessed value.
To further gauge the impact of COVID-19 on sales. A comparison between the number of sales in apartments pre- and post-COVID has also been shown in Figure 6.
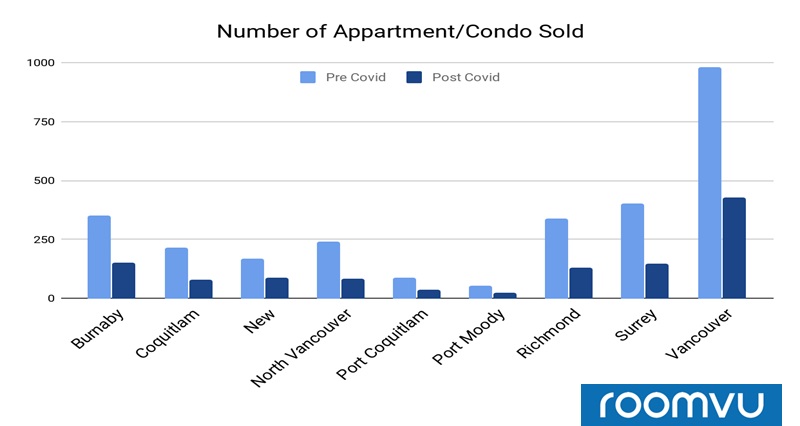
According to the REBGV report, sales for the apartments have decreased by 47.6% YoY. A similar decline can be seen pre- and post-COVID where sales of apartments dropped by 59% in Greater Vancouver. Sales have declined across all municipalities, with North Vancouver, Surrey and Coquitlam being the most affected.
Conclusion
The COVID-19 pandemic has had enormous effects on nearly every segment of the economy—the real estate market included. While YOY changes in sales of both detached and attached homes are staggering, with most jurisdictions in the Western world gradually easing themselves out of lockdown, there could be brighter times ahead for both the real estate market, and society in general.