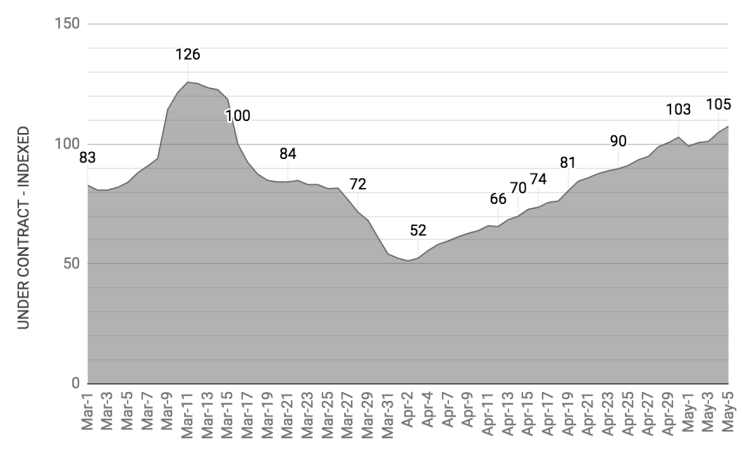
- The Greater Seattle Area has experienced one of the largest COVID-19 real estate market slow-downs in the US. Under contract listings reached their lowest-point on April 2, down 49% from pre-COVID levels. As of May 5, that number had increased by 56% from April 29 levels, which was 7% above pre-COVID levels.
- Median prices were mostly increased. They became slightly higher almost in all boroughs
- Realtors have begun adjusting the new COVID reality by figuring out how and when to safely show listings to prospective buyers, using virtual tours as a way to weed out less-serious buyers, and leveraging technology to review and accept inspections, perform appraisals, closing, and other requirements.
- Employees being forced to work from home have adapted to this new way of working, making commercial real estate in densely populated downtown areas less-attractive, and making residential homes with extra rooms for home-office space in less expensive suburbs more attractive.
The effects of the COVID-19 pandemic on real estate markets have been evaluated and discussed at length by market observers. For our part, roomvu has published articles looking at the future of real estate, as well as COVID-19’s impact on accelerating the use of digital tools like virtual tours.
The pandemic outbreak and stay-at-home orders enacted by state and federal authorities have resulted in significant changes to day-to-day operations and the overall health of several sectors of the economy. With respect to the real estate industry, negative impacts have been characterized by a significant reduction in on-site home viewings, as well as in the number of listings and overall sales.
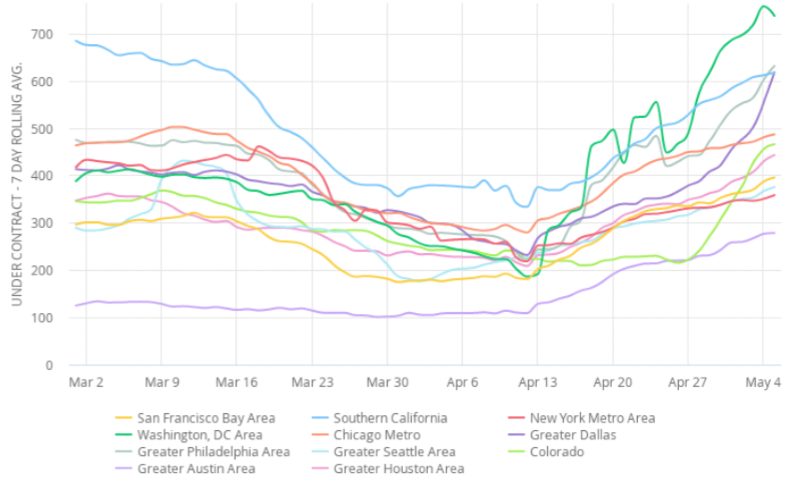
A recent report published by Compass Real Estate in May 2020 highlights “under contract listings” as the most useful indicator of buyer demand in the US housing market, and showed that the real estate market bottomed out in many US cities sometime between March 31 and April 13.
The most dramatic decline was seen in Greater Seattle, as well as the New York and Washington, D.C. Metro Areas, where under contract listings declined 49% from pre-COVID levels. The most impressive rebound, however, has been in the D.C. Metro Area, where under contract listings have climbed 149% since reaching the bottom.
For more information on latest housing trends in Greater Seattle, check out our latest production of market updates:
An indexed value highlighting the number of under contract listings in the Greater Seattle Area can be found in figure 2. Under contract listings reached their lowest-point on April 2, down 49% from pre-COVID levels. As of May 5, that number had increased by 56% from April 29 levels, which was 7% above pre-COVID levels.
In its April report, Northwest Multiple Listing Service (NWMLS) reported that new listings, pending sales, and closed sales declined across the board in King Country in April 2020 vs 2019. In March of 2020, there were 3,787 new listings in the County, that number dropped by more than a thousand to 2,707 in April. Closed sales were down 16% in that same time-period, and down 24% year-over-year. Median home prices increased from $645,000 to $650,000 between March and April 2020; and 4% year over year.
Figures 1–3 illustrate median sale prices for different neighborhoods within King County in 2019 and 2020. Figure 1 contains data for all types of properties, while Figures 2 and 3 are dedicated to single family homes and condos respectively.
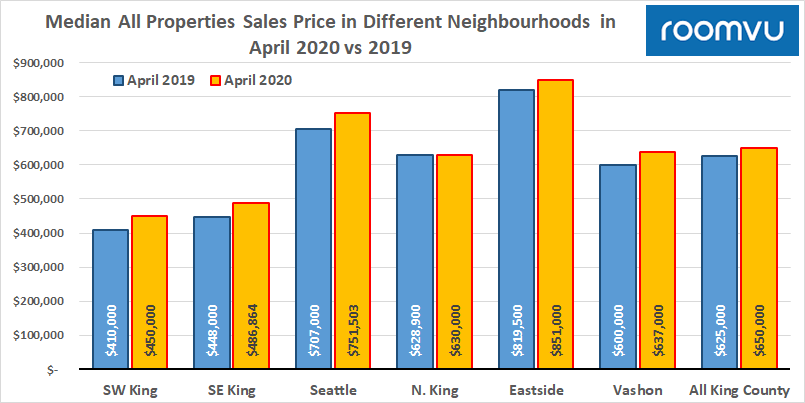
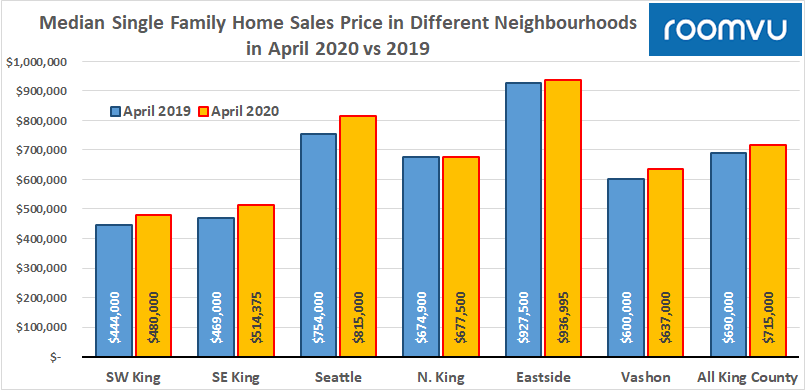
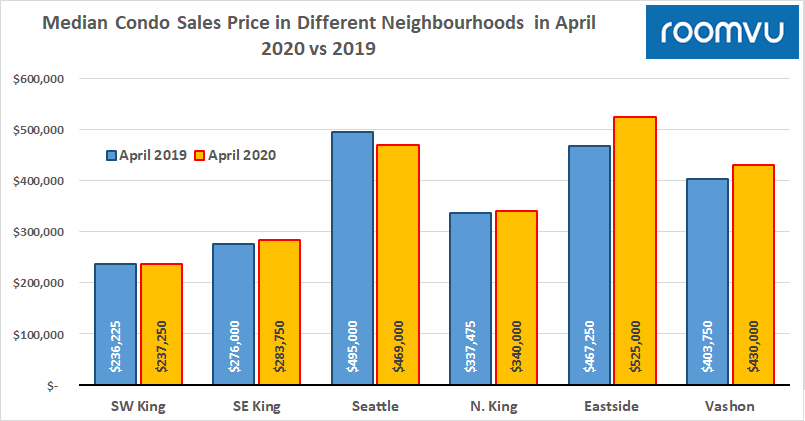
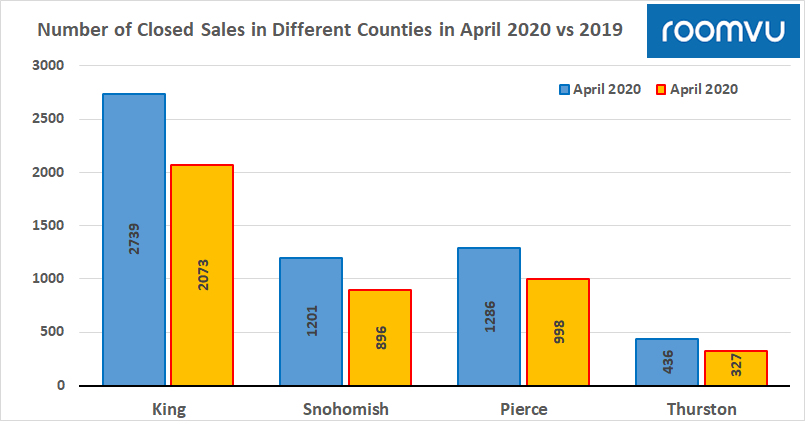
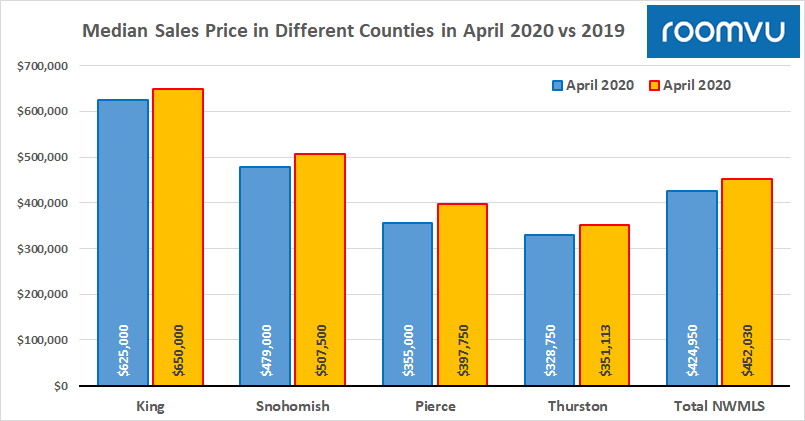
FIgure 4 shows the number of closed sales in four main counties featured in the NWMLS report, and Figure 5 the median sale prices of closed sales. The average price in 2020 is higher than in 2019 for all featured counties.
“With the first full month of post-COVID-19 data in hand, it’s clear the Puget Sound housing market has been hit but not knocked out,” Windermere Chief Economist Matthew Gardener said in a news release. “The normally active spring market is significantly slower than normal due to COVID-19, but it has not come to a halt.”
The Seattle area housing market continues to see low inventory and strong buyer demand, said J. Lennox Scott, chairman and CEO of John L. Scott Real Estate. “We are seeing buyer demand coming forward. With historically low interest rates, the local market needs additional listings to meet pent-up demand from the backlog of buyers,” he said. Scott said they are virtually sold out in homes at more affordable price ranges.
Home buying activity appeared to be trending upward in the latter weeks of April, though new listings and pending sales were still well under 2019 levels.
Prices in King, Pierce and Snohomish counties rose 6.9% year-over-year in March 2020, outpacing national averages for the fourth consecutive month. Nationally, prices increased year-over-year by 4.4% on average in March 2020, up from 4.2% in February. Home prices around Seattle increased by 2.5% from February to March 2020. Only in Phoenix, AZ, where prices shot up by 8.2% year-over-year showed stronger growth among US cities and counties during this time period. The new numbers demonstrate the housing market was stable and growing before the coronavirus pandemic developed into a national emergency in April.
Prices in Seattle saw the strongest gains in less-expensive homes. Houses selling for less than $439,000 saw price increases of more than 10% year-over-year—the largest increase since late 2018. Home prices exceeding $655,000 rose by 6%; and those that fell between these two points rose by 7%.
“Not surprisingly, those who truly need to buy and sell have never left the marketplace,” Dana Rice, a Washington D.C.-based senior vice president at Compass, said in a statement. “And now that the ‘new normal’ is in place, buyers are coming back and sellers are still listing properties.”
“The number of [home] sales were down by 13 to 20 percent in April, that’s a big number, but the beautiful thing is that the April reports were better than expected because prices were up on average 4 percent,” Barbara Corcoran recently told FOX Business, noting the challenge real estate agents face by not being able to show homes in person.
“There’s going to be a migration — at least short term — from the city areas. If you look at New York City, Miami and San Francisco, those sales numbers are down 40 percent, that’s so much more dramatic compared to everywhere else,” Cocoran told FOX Business’ Neil Cavuto. “I don’t think you’ll see those city areas recovering quite as well as people are hoping they’re going to.”
Cocoran says as big tech companies such as Twitter and Google allow employees to work from home indefinitely, there is a desire for potential buyers and sellers to have more housing and commercial space. “People have adjusted to actually working at home. It really has changed the desire to commute,” Cocoran said. “You’ll even find that employers are going to say, ‘Why am I going to fight that if people are being productive at home.’”
Another report by Zillow suggested that three-quarters of Americans working from home because of the coronavirus say they want to continue if given the option. And two-thirds say they would consider moving if given that flexibility. Larger homes with more rooms and offices could draw those longer worried about their commute out of urban cores and into the suburbs and exurbs.
It is possible that following the first 21st-century pandemic, the public’s tendency would be towards buying in the residential real estate market in the suburbs instead of more populated downtown areas where there’s a higher chance of being exposed to another high-risk epidemic.
As we come to understand the first batch of real feedback from the work-from-home experience — something that has always been suggested as a way to reduce traffic, CBD’s high densities , and for the sake of public health — it would appear that working from home is a tenable option for many companies, certainly high-tech companies. This could lead to a further slump in commercial real estate that could foreshadow the future of the Greater Seattle Area real estate market as well.
“There’s a lot more concessions to be had versus pre-COVID,” according to Noah Rosenblatt, CEO of UrbanDigs, a Manhattan real estate data firm. “If you can get two months free at $3,500 a month, your net effective rent goes way down. It’s just another way of getting that rental rate reduced in an environment where landlords typically are not so quick to start rushing to reduce those rents.”
*Featured Photo by Zhifei Zhou on Unsplash