What is Vancouver’s real estate market like for the top three realtors?
To better understand the current Vancouver housing market situation, we compared the data from the top three Vancouver realtors that had the most number of sales in 2016 with their number of sales in 2019 for West Vancouver and East Vancouver (Figure 1 and 2).
What was discovered was that even the top three Vancouver realtors are selling 50% fewer properties than they did in 2016.
But interestingly, even though most neighborhoods took an impact on the number of properties sold by the top three agents, not all of the neighborhoods did. As we can see in figure 1, Hastings-Sunrise, Strathcona and South Marine for Vancouver East, seemed to have sold more properties by the top three agents in 2019 than they did in 2016 despite the cooling housing market.
The Total Number of Sales by the Top Vancouver Agents in 2016 and 2019:
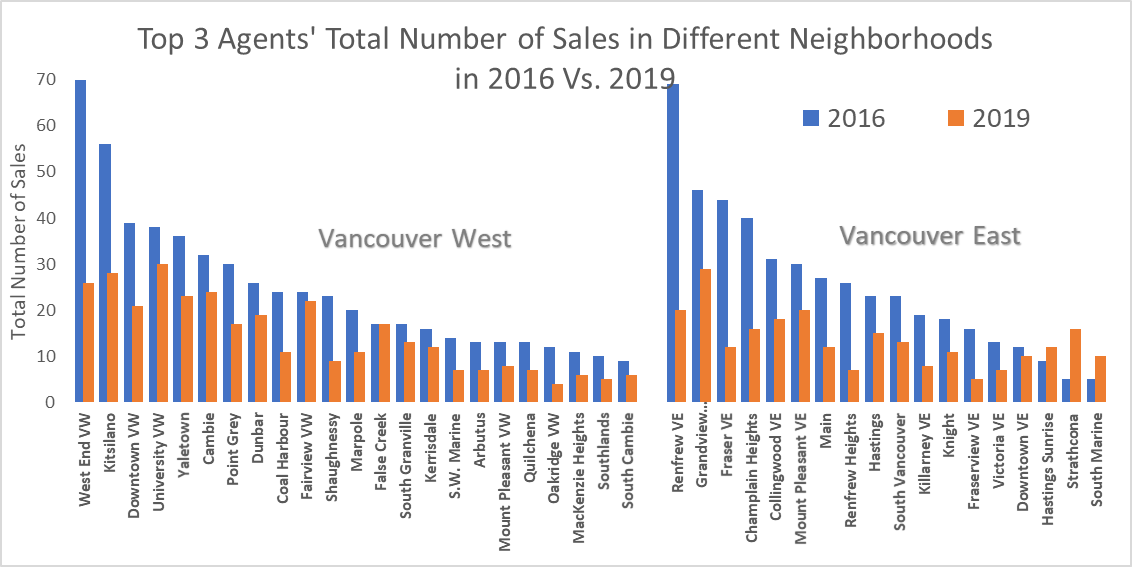
Figure 1: The number of sales by the top three agents 2016 (blue) versus 2019 (orange)
But what happened in Vancouver East – South Marine, Strathcona and Hastings-Sunrise?
In 2016, South Marine, Strathcona, and Hastings-Sunrise were three neighborhoods that had the least amount of properties sold by the top three realtors. But in 2019, although these neighborhoods still did not take the cake for the majority sold by the top three realtors, they were the only neighborhoods in East Vancouver that experienced a dramatic growth despite surrounding neighborhoods that took a major plummet.
The major reason for these spikes area:
- Development and new housing in South Marine, Strathcona and Hastings-Sunrise
- Affordable living compared to the rest of East Vancouver.
The take-away
Almost all neighborhoods took an impact due to changes in the Canadian economy and the cooling-off of the BC housing market. Even the top three agents experienced a dramatic drop in properties in both Vancouver East and West.
Although it may seem as if some neighborhoods were not impacted by the cooling-off of the housing market in accordance with Figure 1 and Table 1, the neighborhoods that show an increase in property sales were, in fact, either going through development or offering more affordable housing.
Is the development of creating a hoax of a recovering housing market for Vancouver? It’s a question worth further discovery.
A message from roomvu’s CEO, Sam Mehrbod:
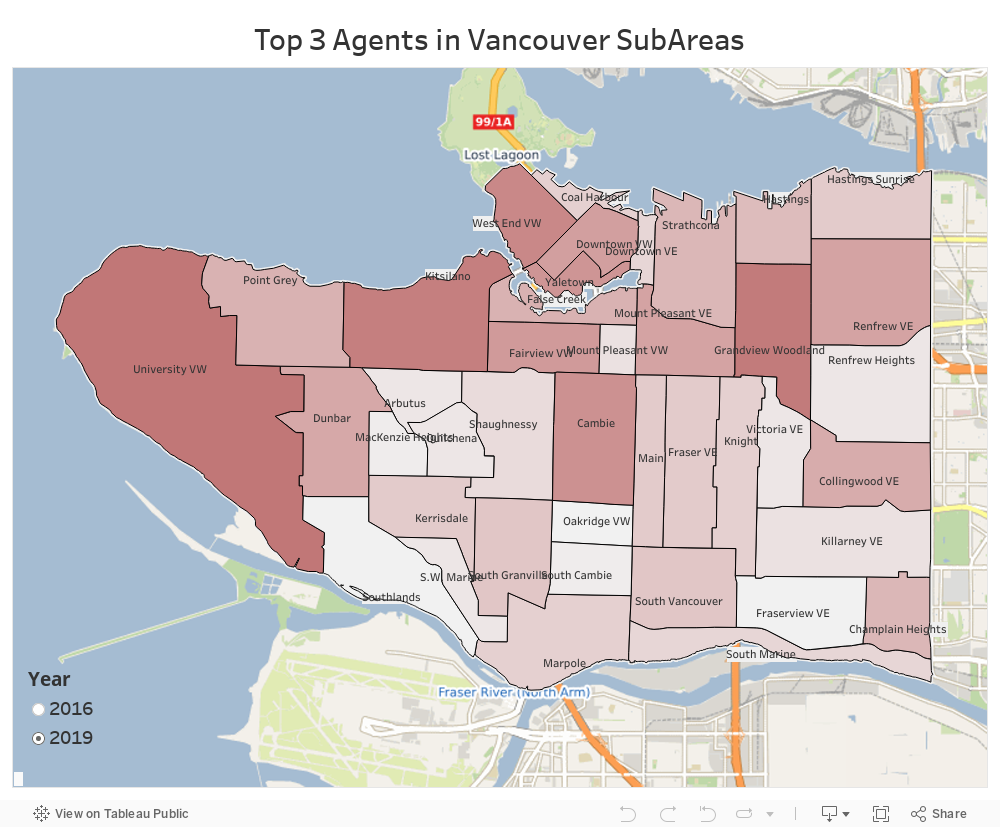
At the request of the Real Estate Board of Greater Vancouver, this map view is no longer available for public viewing. Roomvu is built by REALTORs for REALTORs and we dedicate all of our effort to promote and empower our fellow REALTORs. We always welcome any research ideas and collaboration, so please write to us at [email protected]
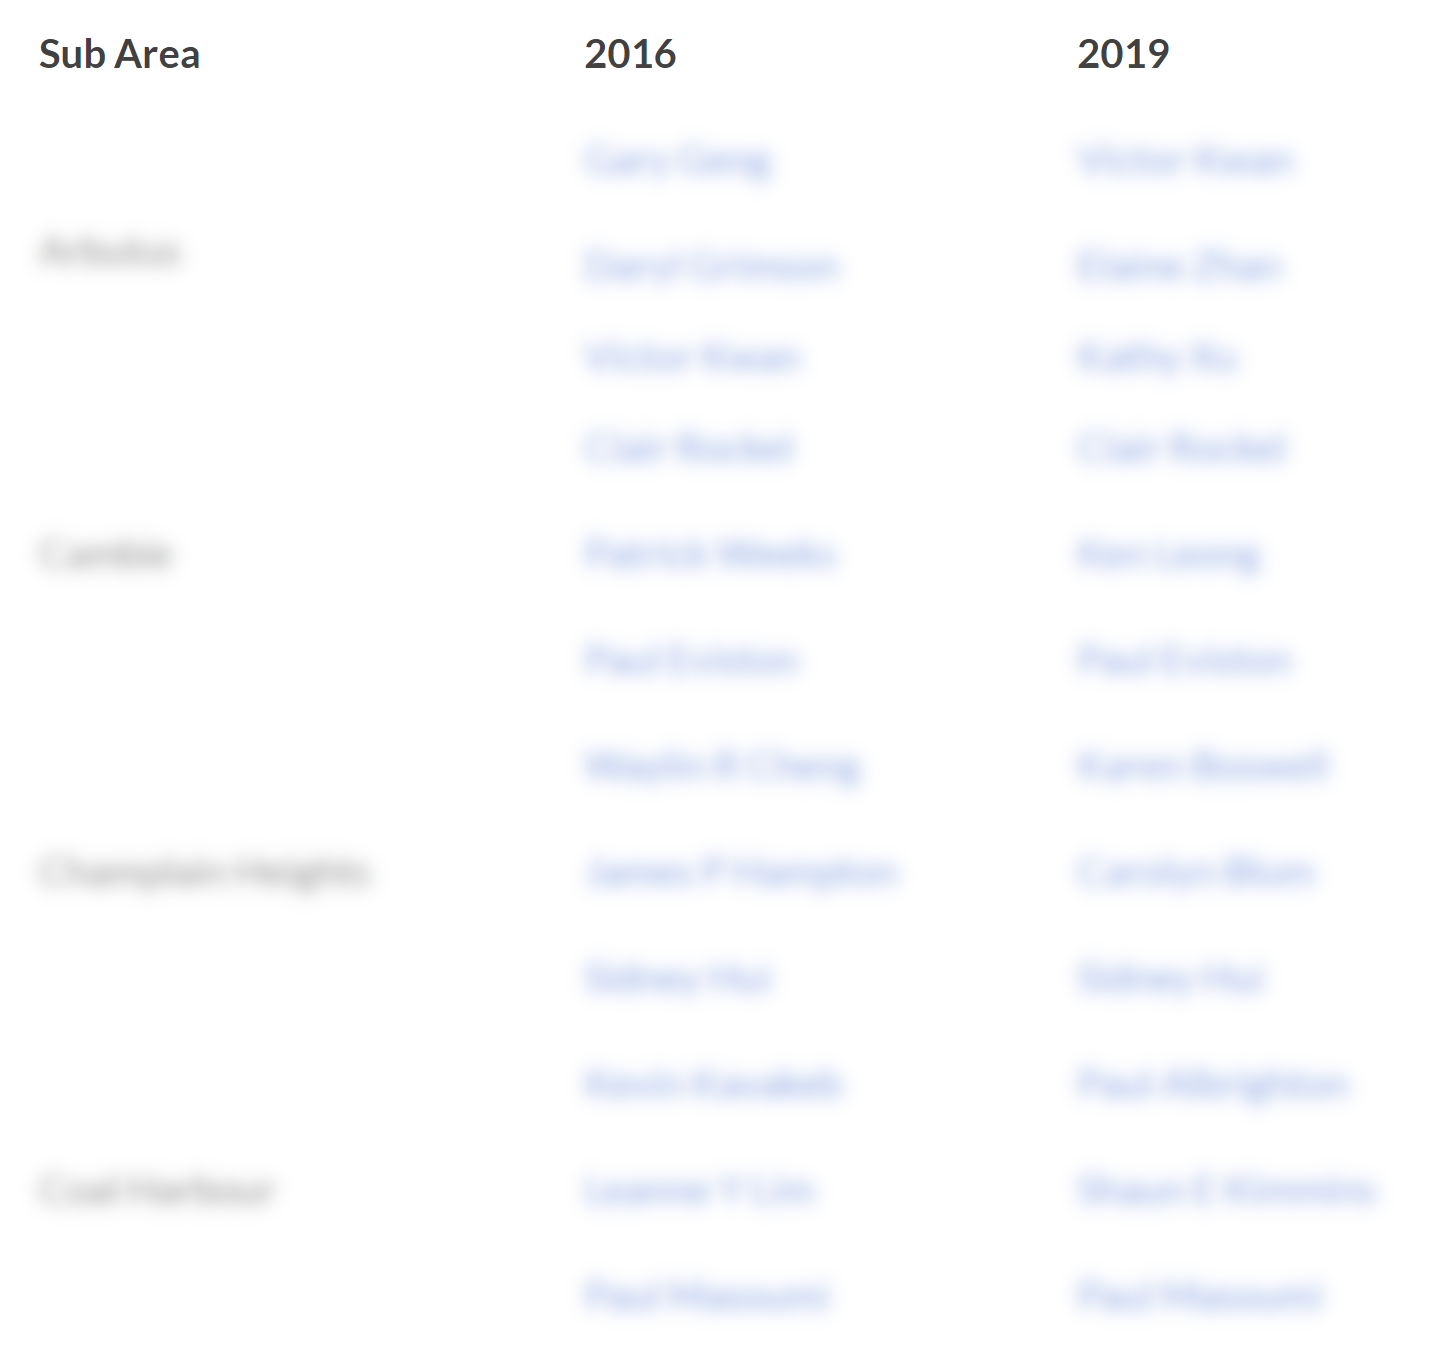
The Top 3 Vancouver Agents per Subarea in 2016 and 2019 and their total number of sales:
Responses