In this article, we compare the production of top Vancouver agents in 2016 and 2019 for each subarea.
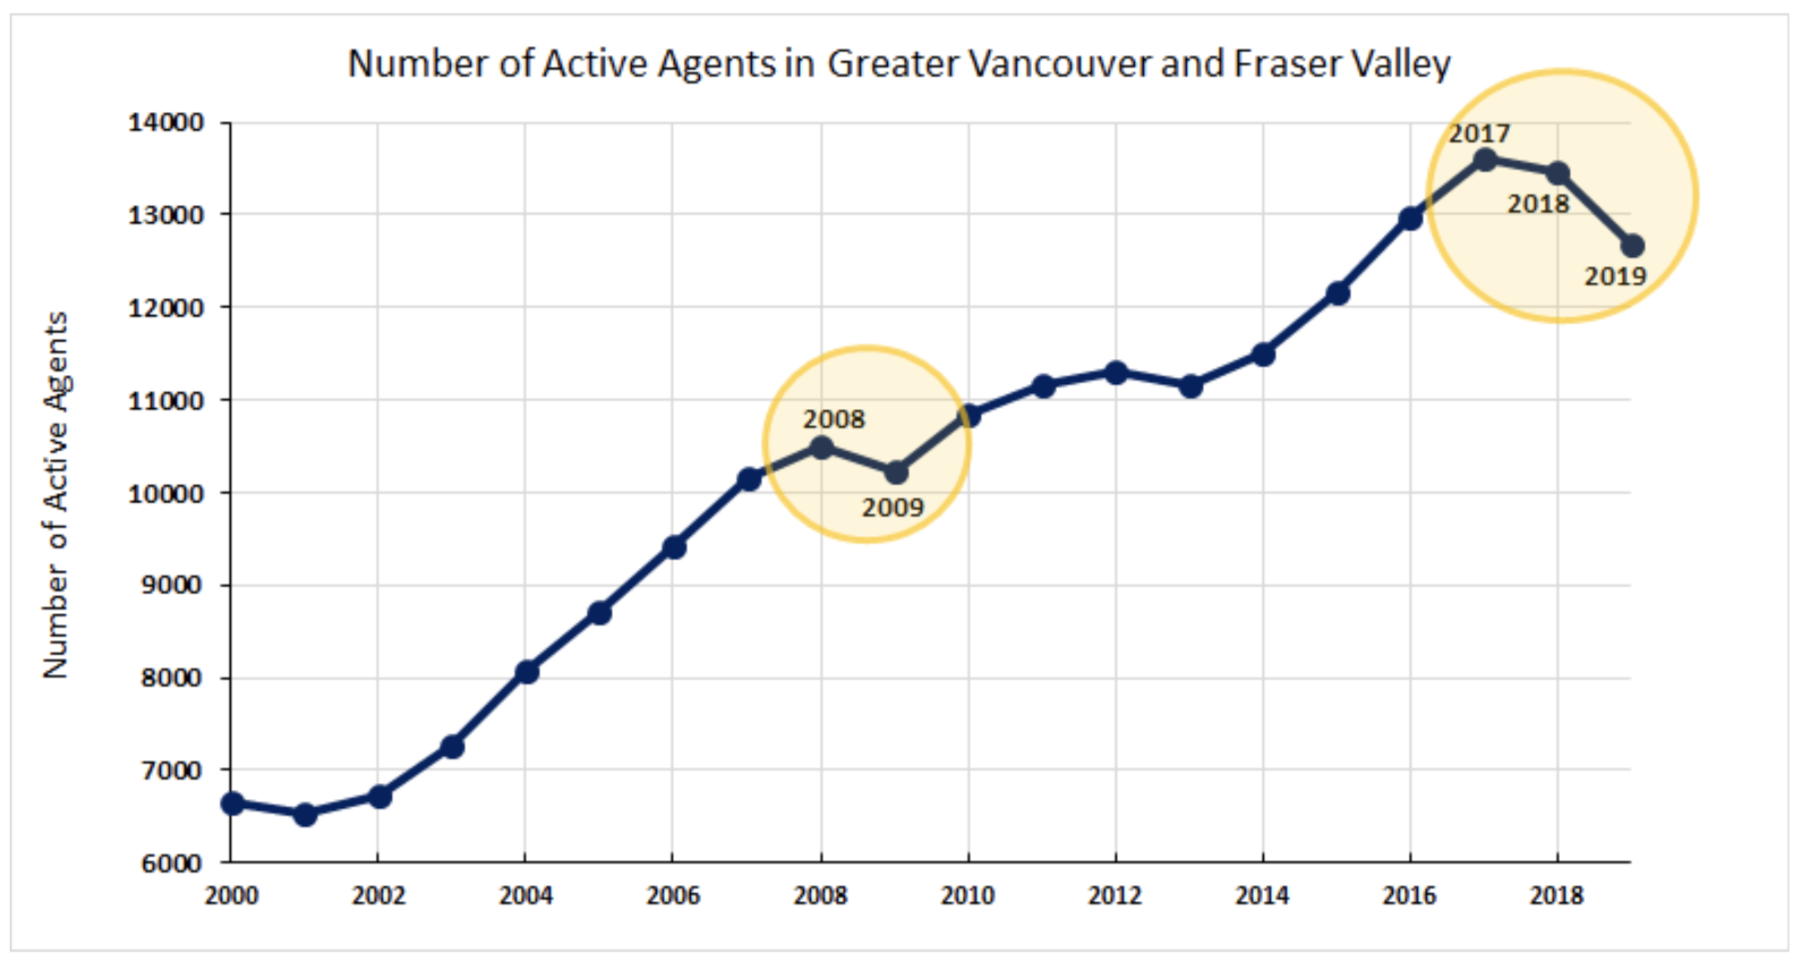
It’s no surprise that there is hefty competition in Vancouver’s real estate market. For instance, in 2017, there were nearly 14,000 agents competing amongst each other as Vancouver’s housing market boomed beyond expectations.
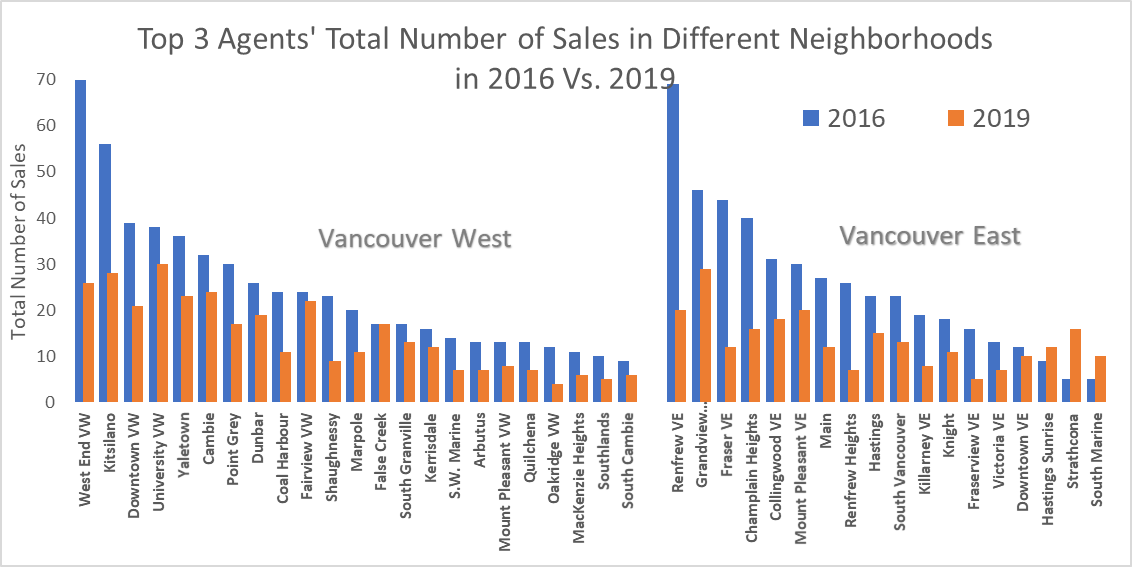
Although now that the number of Vancouver realtors dropped for the first time since 2008 (Figure 1), Vancouver realtors do not see as much competition as they did back in 2016. But this doesn’t mean that selling a home is any less easy than it was as MLS data shows that even the top three agents sold 50% less than they did in 2019 (Figure 2).

Figure 1: The Number of Vancouver realtors trend from 2000-2019

Figure 2: The top Vancouver agents 2019 versus 2016 per subarea
As a result, despite the fact that there are fewer realtors in Vancouver, it doesn’t mean that Vancouver agents who made it to the top for their subarea in 2019, are any less special than the ones who did in 2016.
But, what is most interesting about the top realtors per subarea, is that these agents have truly dominated. Whether it is by excellent marketing (housing prices, competition, etc), knowing the features of the subarea (close amenities, attractions, etc) or even knowing the economic prosperity of the subarea (number of listings, number of sales, new development, popularity, etc.), these realtors thrive in their subarea.
Disclaimer: Since this report was compiled in the October of 2019, in calculating the number of sales in this blog post, the sales data from the first 9 months of 2016 were selected in order to be comparable with the available data of the first 9 months of the year 2019. The first Listing agent and the first buyer (selling) agent is considered in the calculations. so if an agent acting as a secondary listing agent, their numbers won’t show here.
In addition, what is interesting is that, although a three-year break, the majority of the top realtors for their subarea in 2016, remained a top realtor for their subarea in 2019.
Moreover, whether it is the competition that weened out the bottom few agents or the cooling off of the housing market, the top three agents per Vancouver subarea are crushing it in Vancouver real estate, despite selling fewer listing than they may have in 2016. Will this be the case three years from now?
For this article, we had our data scientists at Roomvu in conjunction with UBC Sauder School scientists gather Greater Vancouver MLS data from 2004 to mid-2019 and compare the performance of each agent in the year 2016 and 2019.
Top 3 Agents in Vancouver SubAreas (Interactive Map)

A message from roomvu’s CEO, Sam Mehrbod:
At the request of the Real Estate Board of Greater Vancouver, this map view is no longer available for public viewing. Roomvu is built by REALTORs for REALTORs and we dedicate all of our effort to promote and empower our fellow REALTORs. We always welcome any research ideas and collaboration, so please write to us at [email protected]
In the meantime please read:
Who are the Top 1% of Realtors in Greater Vancouver?
Do Vancouver Buyers Actually Save Money on Pre-sales?
The Rise in Price per Floor-Level | Vancouver Real Estate
These are the Vancouver Neighbourhoods that Will Struggle in 2019-2020
Table 1: The Top Vancouver Agents per Subarea in 2016 Vs. 2019

At the request of the Real Estate Board of Greater Vancouver, this list is no longer available for public viewing. Please feel free to contact [email protected] if you have any inquiries regarding this.
