KEY TAKEAWAYS:
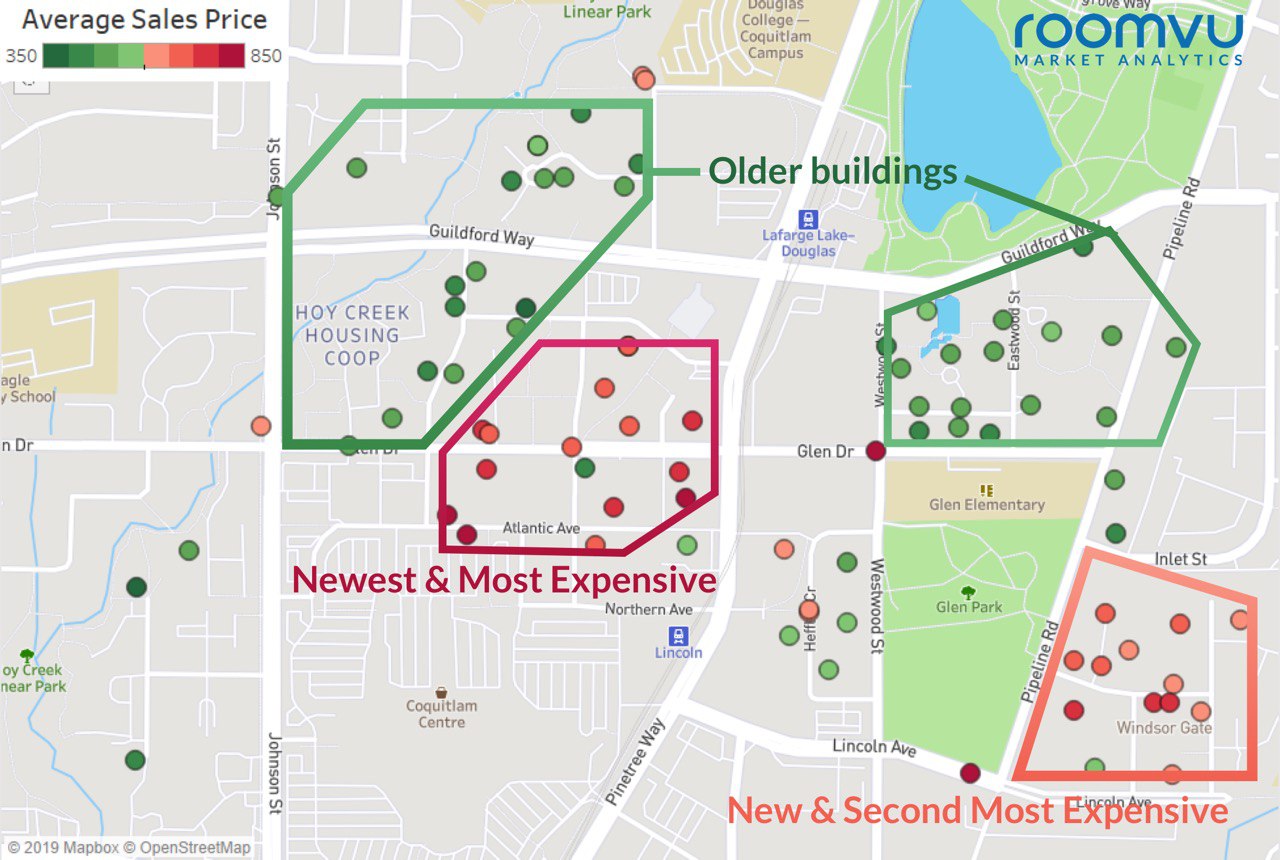
- The most expensive buildings in North Coquitlam subarea and adjacent neighbourhoods sold for an average price of $750-$850 per square foot; those streets were Pinetree Way, Atlantic Avenue, and Glen Drive; These buildings also happen to be directly adjacent to Coquitlam Centre Shopping Mall and Lincoln SkyTrain Station
- Only a couple of blocks away on the east side of Glen Park and Pipeline Road, new condos’ prices per-square-foot go down to around $600-$750.
- Buildings located on either side of Guildford Way down to the Glen Drive are mostly older buildings with an average sales price of between $400-$600 per square foot.
As urban sprawl reached past Burnaby and into the Tri-Cities area, Coquitlam quickly became a destination for families looking to live close to Downtown Vancouver while enjoying lower housing costs. The Evergreen Skytrain expansion into North Coquitlam kicked urban expansion into a higher gear and housing prices have risen accordingly.
An analysis by Roomvu Technologies, a Vancouver-based real estate analytics company, looked at 2018-2019 MLS (Multiple Listing Service) data for buildings located around Coquitlam Town Center, including condos in North Coquitlam (see map below). The data allowed them to pinpoint the most and least affordable city blocks in the area based on price per square foot.
The results: residents in the area can expect to pay somewhere between $750-$850 per square foot to live in the buildings right above the Coquitlam Centre Mall and Lincoln SkyTrain station. The buildings were mainly built within the past 10 years and are mere steps away from two shopping centres (Henderson Place being the second). What’s more, the Evergreen Line SkyTrain expansion made commuting to and from Downtown convenient. All these factors conspire to make Pinetree Way, Atlantic Avenue and Glen Drive home to three of the most expensive condos in the area.
Only a couple of blocks away on the east side of Glen Park and Pipeline Road, prices per-square-foot go down to around $600-$750.
But the most affordable buildings in this neighbourhood are – without surprise – the older ones, aged 20 to 34 years old. Located on both the north and south sides of Guilford Way down to Glen Drive, the average price in these buildings is between $400 to $600 depending on their age and quality of renovations.
Click here to view an interactive map of prices per square foot in North Coquitlam Neighborhood.
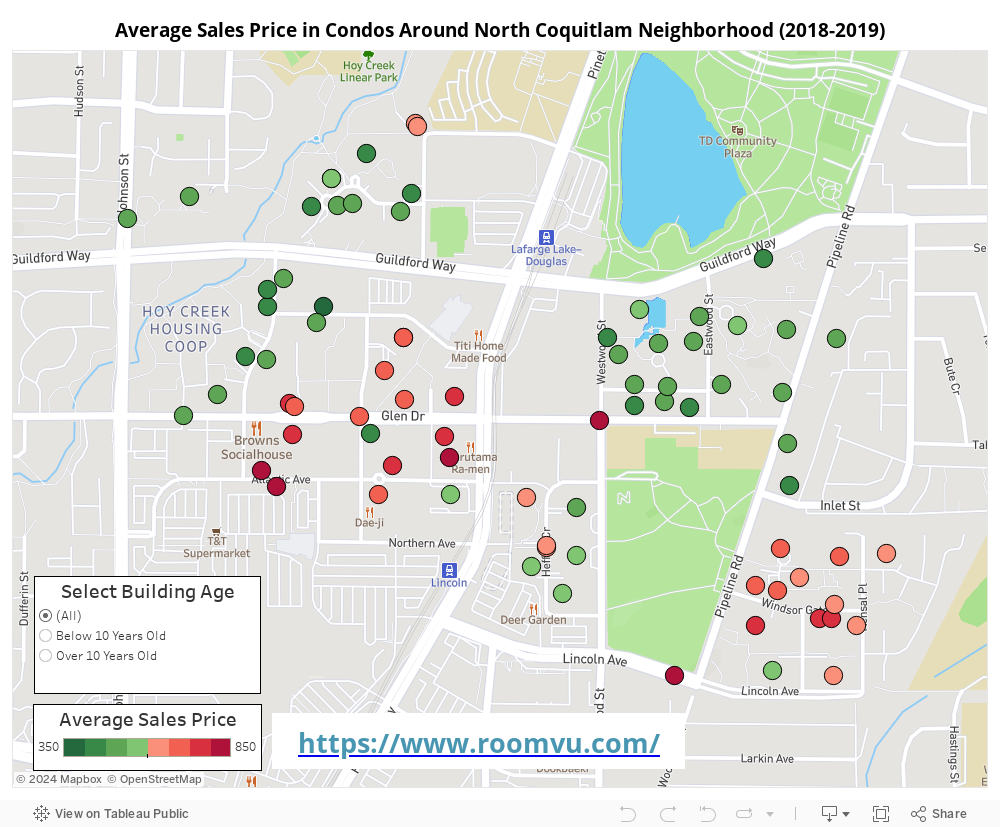
Average Sales Price for over and below 10-Years-old Buildings in North Coquitlam and Adjacent Neighborhoods (Condos, 2018-2019)
| Rank | Building | Average Price ($ per Sqft) | Age | # of Sales Records |
| 1 | 1188 PINETREE WAY | $845 | 3 | 44 |
| 2 | 1182 WESTWOOD | $814 | 0 | 26 |
| 3 | 2975 ATLANTIC | $804 | 4 | 25 |
| 4 | 3080 LINCOLN | $797 | 2 | 24 |
| 5 | 2955 ATLANTIC | $788 | 5 | 26 |
| 6 | 3008 GLEN | $780 | 6 | 22 |
| 7 | 3007 GLEN | $771 | 3 | 19 |
| 8 | 1155 THE HIGH | $757 | 7 | 25 |
| 9 | 3100 WINDSOR GATE | $745 | 1 | 24 |
| 10 | 3102 WINDSOR GATE | $737 | 6 | 18 |
| 11 | 3096 WINDSOR GATE | $732 | 0 | 9 |
| 12 | 2968 GLEN | $731 | 6 | 21 |
| 13 | 3093 WINDSOR GATE | $721 | 2 | 29 |
| 14 | 1185 THE HIGH | $708 | 9 | 13 |
| 15 | 2980 ATLANTIC | $705 | 10 | 20 |
| Rank | Building | Average Price ($ per Sqft) | Age | # of Sales Records |
| 1 | 2963 BURLINGTON | $380 | 32 | 4 |
| 2 | 1200 PACIFIC | $430 | 34 | 5 |
| 3 | 1210 PACIFIC | $449 | 34 | 9 |
| 4 | 2985 PRINCESS CRESCENT | $450 | 24 | 11 |
| 5 | 1163 THE HIGH | $453 | 23 | 4 |
| 6 | 2995 PRINCESS CRESCENT | $456 | 25 | 18 |
| 7 | 3098 GUILDFORD WAY | $466 | 22 | 18 |
| 8 | 2960 PRINCESS CRESCENT | $472 | 26 | 6 |
| 9 | 2978 BURLINGTON | $490 | 26 | 4 |
| 10 | 3065 PRIMROSE LANE | $492 | 26 | 5 |
| 11 | 1189 WESTWOOD | $494 | 26 | 8 |
| 12 | 1189 EASTWOOD | $495 | 26 | 9 |
| 13 | 1215 PACIFIC | $498 | 26 | 7 |
| 14 | 3075 PRIMROSE LANE | $500 | 25 | 7 |
| 15 | 1219 JOHNSON | $503 | 27 | 9 |
SkyTrain expansion and increasing amenities will only see to raise the cost of living for those deciding to make Coquitlam their home. With that said, depending on where one wants to settle down, relatively affordable housing is within reach.
Note: The sales data of all the sold units for buildings located around the Coquitlam Town Center including condos in North Coquitlam (Eastern side of Johnson Street), southern parts of Canyon Springs and the west side of New Horizons for 2018 and the first nine months of 2019 were used in this article to calculate the average sales price per square foot for the buildings. The building names and numbers were extracted from the address data and the average price was calculated for any number of listings sold in that building since January 2018. The prices presented here are just the average price for that building; the price for each unit could be different based on the floor number where the unit is located and the quality of renovations made in that specific unit. It should also be mentioned here that the tables show the results only for buildings with at least 4 sales in the 2018-2019 data bank while the map shows all the buildings’ prices even if only one sale is available in the data bank.