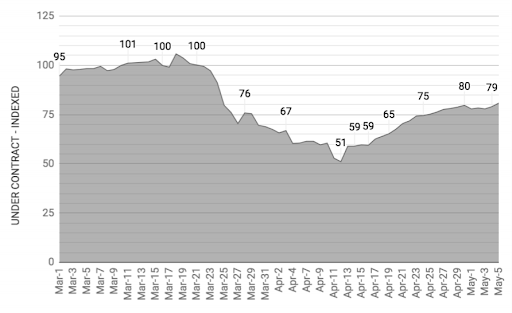
- New York has experienced one of the largest COVID-19 real estate market slow-downs in the US. Under contract listings reached their lowest-point on April 12, down 49% from pre-COVID levels. As of May 5, that number had increased by 30% from April 12 levels, but was still 29% below pre-COVID levels.
- Median prices were mostly unchanged. They became slightly higher in some boroughs and lower in others. However, the rents reductions have been observed in almost all boroughs with an overall decrease in rents of 3-5%.
- Realtors have begun adjusting the new COVID reality by figuring out how and when to safely show listings to prospective buyers, using virtual tours as a way to weed out less-serious buyers, and leveraging technology to review and accept inspections, perform appraisals, closing, and other requirements.
- Employees being forced to work from home have adapted to this new way of working, making commercial real estate in densely populated downtown areas less-attractive, and making residential homes with extra rooms for home-office space in less expensive suburbs more attractive.
The effects of the COVID-19 pandemic on real estate markets have been evaluated and discussed at length by market observers. For our part, roomvu has published articles looking at the future of real estate, as well as COVID-19’s impact on accelerating the use of digital tools like virtual tours.
The pandemic outbreak and stay-at-home orders enacted by state and federal authorities have resulted in significant changes to day-to-day operations and the overall health of several sectors of the economy. With respect to the real estate industry, negative impacts have been characterized by a significant reduction in on-site home viewings, as well as in the number of listings and overall sales.
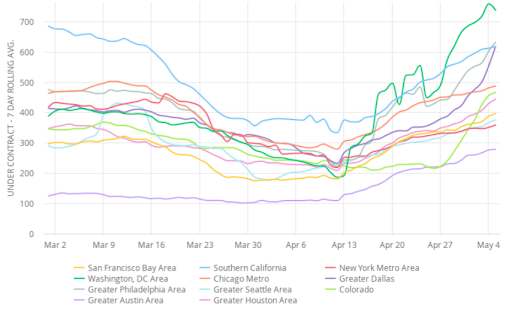
A recent report published by Compass Real Estate in May 2020 highlights “under contract listings” as the most useful indicator of buyer demand in the US housing market, and showed that the real estate market bottomed out in many US cities sometime between March 31 and April 13.
The most dramatic decline was seen in Greater Seattle, as well as the New York and Washington, D.C. Metro Areas, where under contract listings declined 49% from pre-COVID levels. The most impressive rebound, however, has been in the D.C. Metro Area, where under contract listings have climbed 149% since reaching the bottom.
For more information on latest housing trends in New York, check out our latest production of market updates:
An indexed value highlighting the number of under contract listings in the New York Metro Area can be found in figure 2. Under contract listings reached their lowest-point on April 12, down 49% from pre-COVID levels. As of May 5, that number had increased by 30% from April 12 levels, but was still 29% below pre-COVID levels.
Roomvu’s data analysis team has extracted the New York City Residential Sales Reports from the real estate board of New York REBNY and analysed the median sales prices for different types of housing in six boroughs of New York City. The results showed that residential transactions in the first Quarter of 2020 for New York City have decreased by 16% year-over-year, from 10,382 to 8,702. This represents the lowest number of transactions since the 4th quarter of 2011, which saw 7,796 sales. Additionally, all five boroughs experienced a more or less similar decline in the number of transactions, both year-over-year and quarter-over-quarter. Among different types of transactions, condos have dropped by 14% (from 2,096 to 1,799), co-ops by 37% (from 3,037 to 1,908) and 1-3 Family Home by 5% (from 5,278 to 4,995).
What’s more, the median Price Per Square Foot (PPSF) for condos and co-op sales declined by 14% and 15% year-over-year. However median PPSF for 1-3 family homes has increased by 6% since the first quarter of 2019; and median prices overall have increased by 10% in the same time-frame.
Figure 3 shows median condo prices for different boroughs in New York City. The median condo price per SqFt in Manhattan has dropped by 10% in the first quarter year-over-year from $1,511 per SqFt to $1,361 per SqFt. It is important to note that median condo prices have dropped by 6% from $1,525,000 to $1,431,000 overall.
Brooklyn condos have also experienced lower PPSF in Q1 2020 ($803 per SqFt) compared to Q1 2019 ($884 per SqFt). While in Queens and the Bronx, prices rose by 15% and 13% respectively. Since the number of condos sold in Brooklyn and Manhattan is higher than in Bronx and Queens, the entire Metro Area’s median PPSF is more in line with that of the former two boroughs, with a total drop of 14% to $936 per SqFt., down from $1,094.
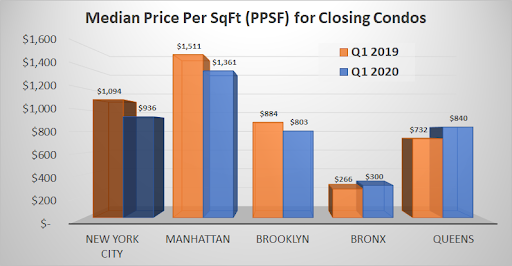
Figure 4 shows median co-op prices in four New York City boroughs. The median co-op unit prices per SqFt in Manhattan, Brooklyn and Queens have risen by 4%, 19% and 21% respectively, while the Bronx is the only borough in which the median PPSF has dropped.
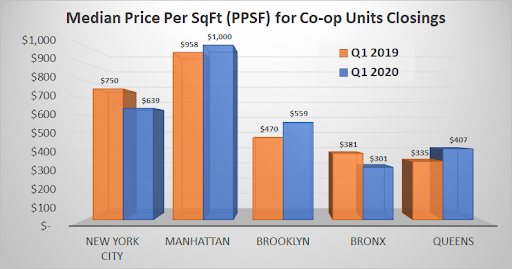
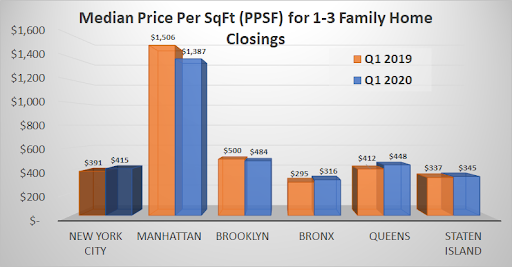
Figure 5 shows median prices for 1-3 family homes in all five NYC boroughs. Prices have increased in the Bronx, Queens and Staten Island but have decreased in Manhattan and Brooklyn. So it is clear from all these figures that the rise or drops in the New York housing prices after the COVID-19 outbreak depends on the boroughs the property is located as well as the type of property and no clear trend can be found in that. Maybe the prices are still following the market demand and supply general rule.
“Not surprisingly, those who truly need to buy and sell have never left the marketplace,” Dana Rice, a Washington D.C.-based senior vice president at Compass, said in a statement. “And now that the ‘new normal’ is in place, buyers are coming back and sellers are still listing properties.”
“The number of [home] sales were down by 13 to 20 percent in April, that’s a big number, but the beautiful thing is that the April reports were better than expected because prices were up on average 4 percent,” Barbara Corcoran recently told FOX Business, noting the challenge real estate agents face by not being able to show homes in person.
“There’s going to be a migration — at least short term — from the city areas. If you look at New York City, Miami and San Francisco, those sales numbers are down 40 percent, that’s so much more dramatic compared to everywhere else,” Cocoran told FOX Business’ Neil Cavuto. “I don’t think you’ll see those city areas recovering quite as well as people are hoping they’re going to.”
Cocoran says as big tech companies such as Twitter and Google allow employees to work from home indefinitely, there is a desire for potential buyers and sellers to have more housing and commercial space. “People have adjusted to actually working at home. It really has changed the desire to commute,” Cocoran said. “You’ll even find that employers are going to say, ‘Why am I going to fight that if people are being productive at home.’”
It is possible that following the first 21st-century pandemic, the public’s tendency would be towards buying in the residential real estate market in the suburbs instead of more populated downtown areas where there’s a higher chance of being exposed to another high-risk epidemic.
As we come to understand the first batch of real feedback from the work-from-home experience — something that has always been suggested as a way to reduce traffic, CBD’s high densities , and for the sake of public health — it would appear that working from home is a tenable option for many companies, certainly high-tech companies. This could lead to a further slump in commercial real estate that could foreshadow the future of the San Francisco Bay Area real estate market as well.
The rental market too has gone through dramatic changes as a result of the pandemic. Based on data gathered by the website Localize.city, rents have fallen for 70 percent of NYC apartments listed prior to the statewide stay-at-home order, which went into effect on March 20. Price reductions have been observed in all five boroughs with an overall decrease in rents of 3-5%.
For instance, rental prices for one-bedroom apartments in Brooklyn have decreased by 4.3% on average to $2,700 per month, while rents on the island of Manhattan have dropped 2.4%, with the average monthly rental price now at $3,780.
“Those may not be mind-blowing reductions, but they’re a signal that rents are trending downward, and likely to continue doing so in the midst of the city’s public health crisis”, said Steven Kalifowitz, president of Localize.city. “I expect we will see people either moving to get a better deal on a bigger / better place, or others downsizing to accommodate lower salary expectations.”
“There’s a lot more concessions to be had versus pre-COVID,” according to Noah Rosenblatt, CEO of UrbanDigs, a Manhattan real estate data firm. “If you can get two months free at $3,500 a month, your net effective rent goes way down. It’s just another way of getting that rental rate reduced in an environment where landlords typically are not so quick to start rushing to reduce those rents.”