Summary
- Apartment buyers in the Greater Vancouver area are exhibiting an increased willingness to pay for an apartment in 2020. Buyers in 2019 paid, on average, 5.2 percent below assessed value for an apartment, while buyers in 2020 are willing to pay an average of 4.4 percent above assessed value
- The Covid-19 lockdown has not noticeably dampened buyers’ willingness to pay for an apartment unit. The average price for an apartment still remains 4.5 percent above assessed value in the post-Covid19 lockdown period
- Despite several disruptions to public transport in 2020, particularly during the Covid lockdown, buyers’ appetite still remains strong for apartment units close to Skytrain stations. Our data indicate that buyers are willing to pay excess dollars over the assessed value to own these units
Main Findings
The recent Covid lockdown and social distancing measures appear to have significantly dampened activity in some segments of the Greater Vancouver real estate market. (Our previous research noted a significant drop in median prices for detached homes.) However, in the apartment sector, serious buyers in 2020 are willing to pay more than assessed values to own a unit in a prime location.
“It looks like access to transit got more valuable over the course of time. Prices of transit-friendly homes rose over the course of the year in spite of the far-reaching negative economic consequences of the pandemic,” said Thomas Davidoff, economics and professor at UBC’s Sauder School of Business.
“Social distancing measures have undeniably made selling a home more difficult, as traditional ways of selling a home like open-houses and in-person tours have become difficult or impossible. That said, we still continue to see a very strong relationship between price point and sales performance, both in terms of sales to listings and price relative to assessment,” he added.
As a part of the effort to investigate the effect of Covid-19 on the real estate market, our data team at Roomvu attempted to capture the difference in the buyers’ willingness to pay more than a property’s government assessed value in the period pre- and post-Covid lockdown.
Rather than examining prices, the difference between sales price and government assessed value does a better job of capturing the market’s sentiment. As described by Sam Mehrbod, a local Realtor and Roomvu’s CEO:
“There are difficulties when comparing pre- and post-Covid-19 average or median sale prices,” explains Sam Mehrbod. “Average or median prices can quickly become skewed based on outliers, while prices require ongoing trends to provide meaningful data,” he added.
“Assessment values rise and fall based on a variety of characteristics: sub-area trends, renovations, property attributes, and market conditions, among others. Whereas the difference between sales price and assessed value can provide a better measure of a market’s activity.”
Using available data, the period from January 1st, 2020 to March 15th, 2020 has been identified as the pre-Covid lockdown period; the post lockdown period is defined as March 15th, 2020 to May 31st, 2020.
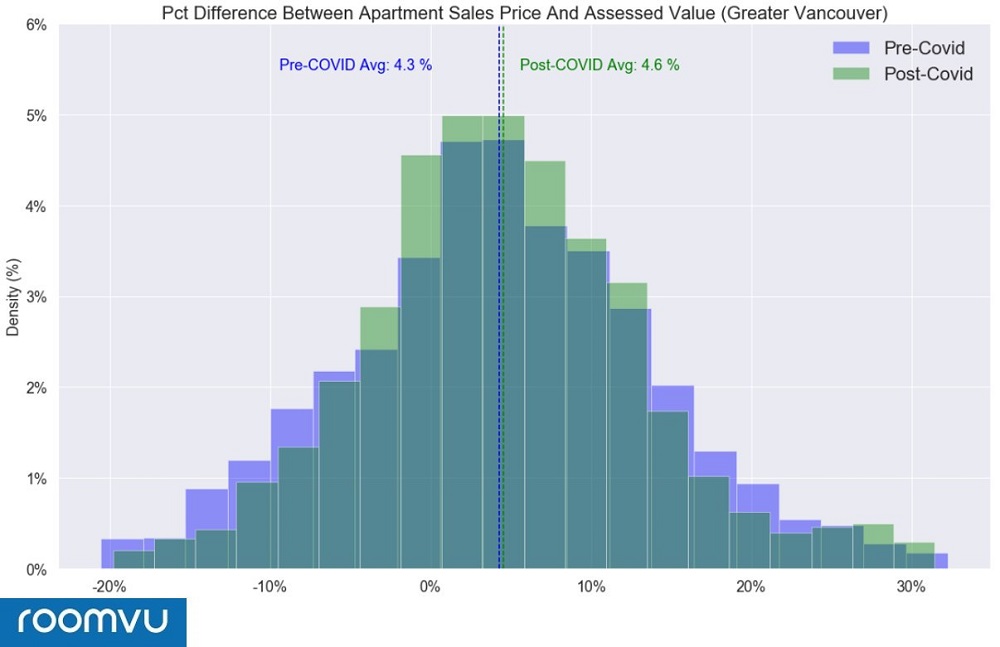
As shown in figure 1, the majority of apartments sold in 2020 in Greater Vancouver are priced above their assessed value. On average, the final sales price of an apartment is 4.4 percent above the assessed value. The overlapping distribution in figure 1 for the time period pre- and post-Covid lockdown indicates that the lockdown has had a minimal effect on buyers’ willingness to pay above the assessed value for an apartment. In fact, buyers are willing to pay even slightly higher at 4.6 percent above assessed value post-lockdown, compared to 4.3 percent before the lockdown.
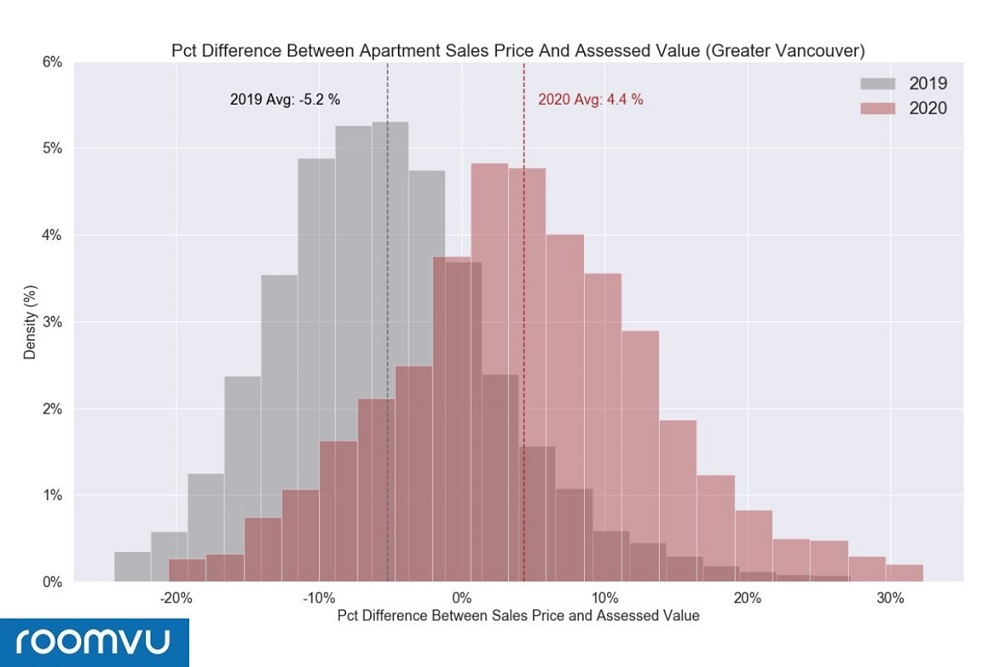
By contrast, it is apparent that this willingness to pay above market price is a recent development in 2020. Figure 2 compares this same measure across 2019 and 2020. The rightward shift in distribution in 2020 indicates a visible increase in the number of apartments sold above their assessed value in 2020. In fact, the majority of apartments in 2019 were sold below their assessed value, at an average of 5.2 percent below assessed value. Conversely, the majority of 2020 apartments have been sold at an average of 4.4 percent above their assessed value. This positive trend persists even in the post lockdown period.
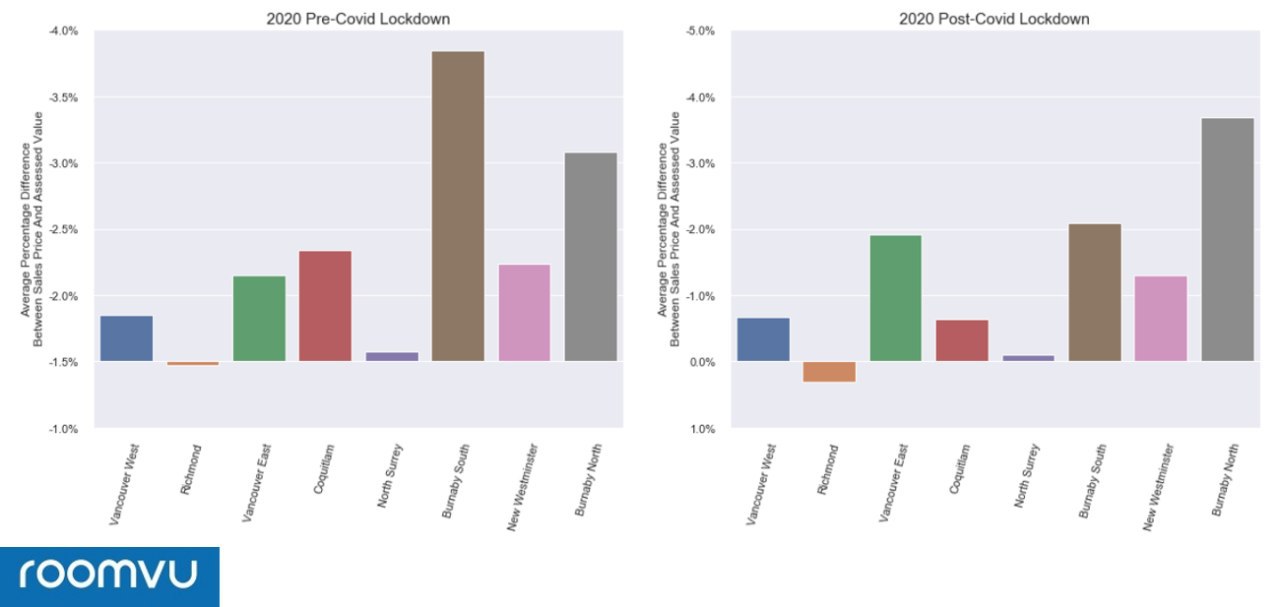
This trend is apparent at the sub-area level as well, where the average percentage paid over assessed value for a standard apartment is uniformly positive across all major areas with a slight increase from pre- to post-Covid period. Our previous article noted that the percentage in which buyers are willing to pay over the assessed value for condos has dropped. However, our recent findings show that, controlling for the same type of apartments, there is no significant drop in buyers’ willingness to pay. The results seem to indicate that while buyers are switching towards smaller, lower-priced units, they are still willing to pay well-above assessed value for these units.
The areas in which buyers are willing to pay the most over assessed value are Vancouver West, Vancouver East, and Coquitlam (at 5 percent, 5.6 percent, and 6 percent in the post-Covid period, respectively). On the contrary, Richmond is the area in which buyers are least willing to pay over the assessed value at 2.3 percent post-Covid.
The detailed breakdown for each area is as shown in figure 3. Values are calculated for an apartment of average size and age in 2020.
Transit Proximity
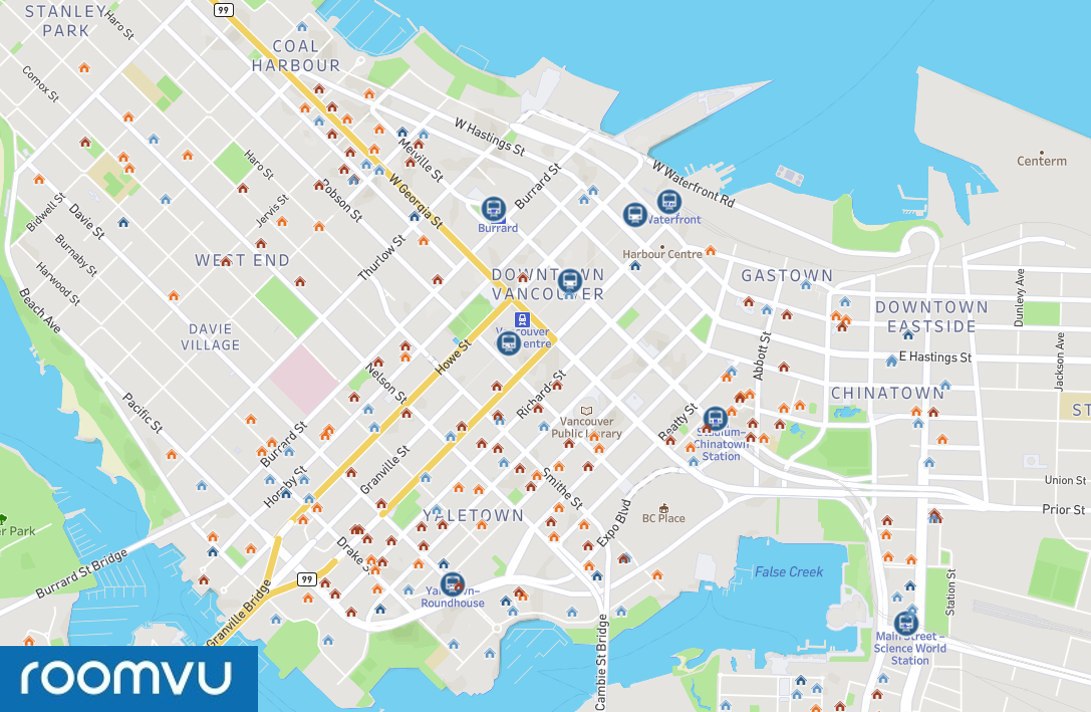
Along with many lifestyle changes, Covid-19 has brought about another significant impact on travel. As the lockdown came into full effect, Vancouverites were encouraged to avoid public transit where possible to limit the spread of the virus. The analytics team at Roomvu investigated whether this possible aversion to public transit would affect buyers’ appetite for units close to Skytrain stations. Figures 4 and 5 show the locations of apartments sold in 2020 relative to Skytrain stations, colour-coded with percentage differences across sales price and assessed value.
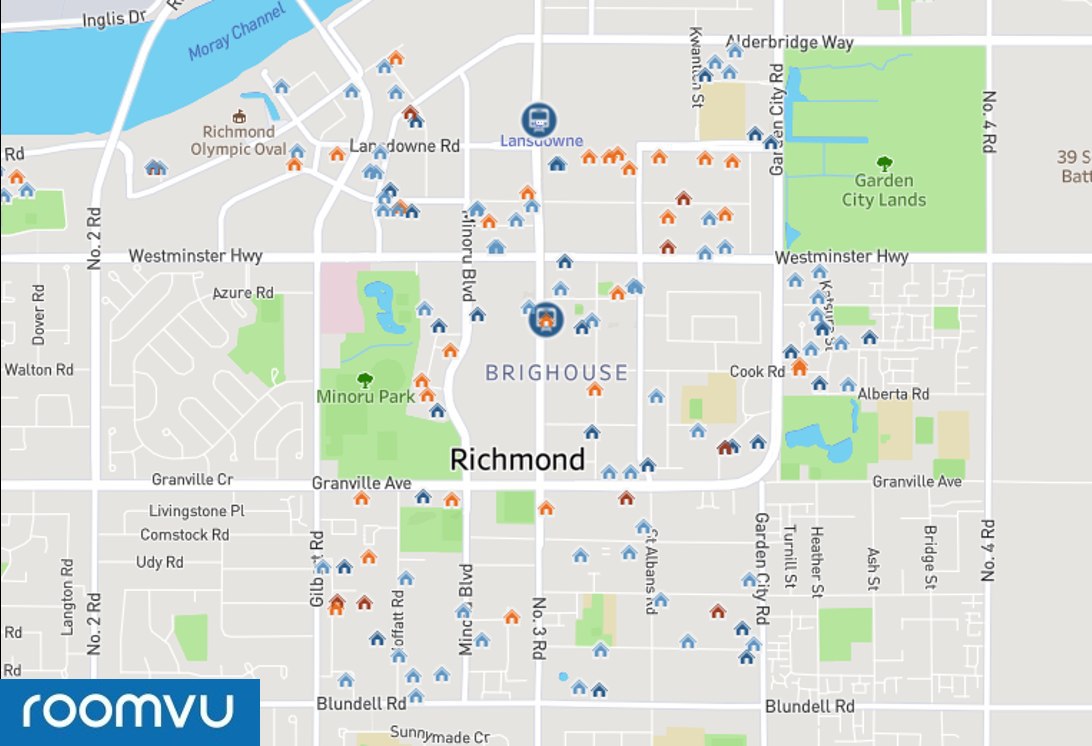
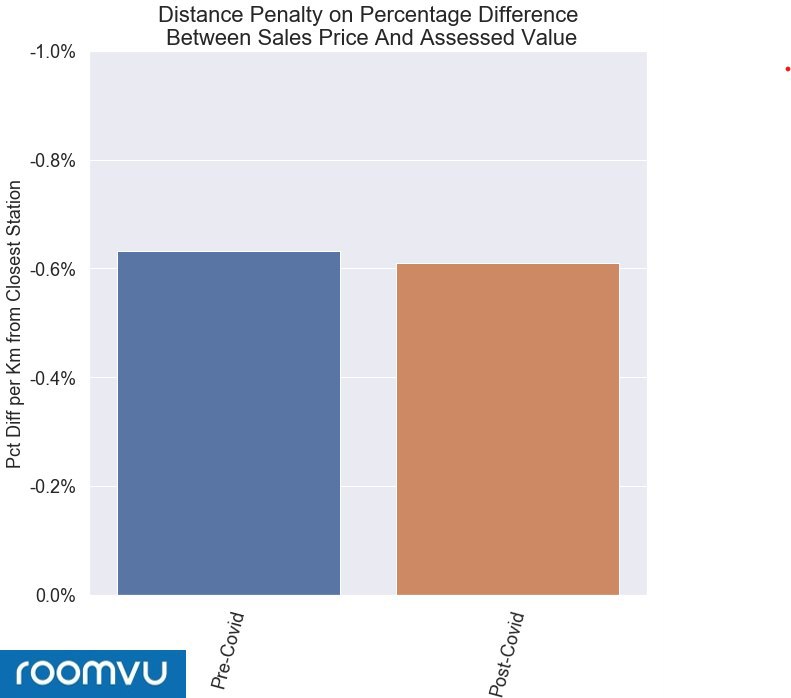
While there is no immediately evident trend on the map, an interesting pattern emerged when a regression analysis was enacted to control for different characteristics of apartments. Particularly, there was a strong relationship between the distance from the closest transit location and the percentage differences between sales price and assessed value. Based on our analysis, for every kilometer away from the closest stations, buyers are likely to pay 0.63 percent less over assessed value in the pre-Covid period. The number dropped slightly to 0.61 percent for every kilometer in the post-Covid period, but remains within the same statistical bound.
The result clearly indicates that apartment units close to the stations are still being sold at a premium over their assessed values in the post-Covid lockdown period.
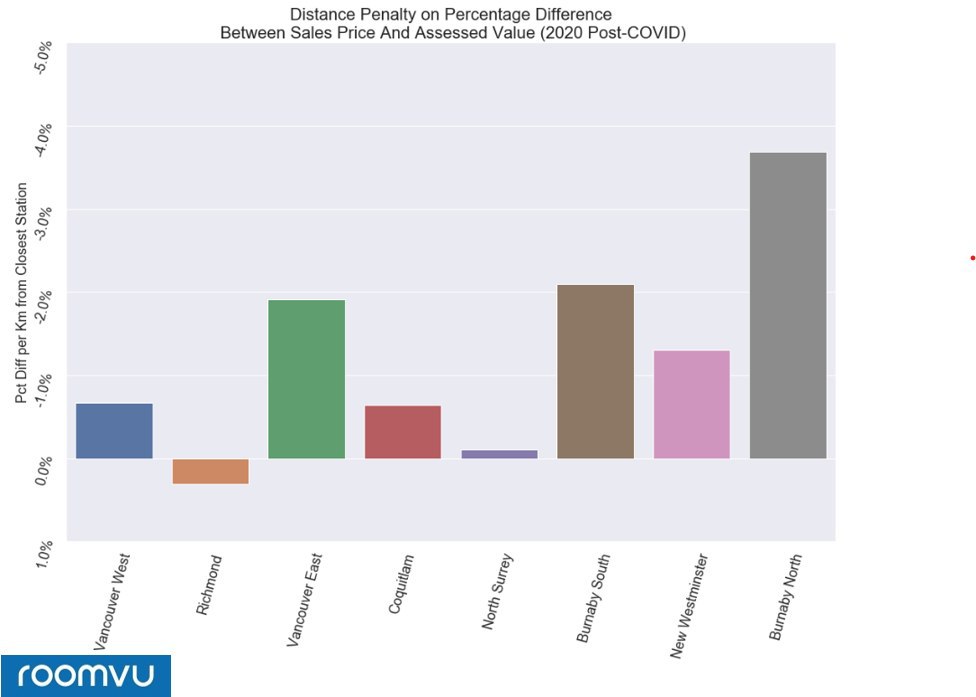
Breaking down the result further by major areas reveals that this preference for being in close proximity to Skytrain stations is even more pronounced, as shown in figure 7. Home buyers in Burnaby North, Burnaby South, and Vancouver East are most willing to pay an additional premium over assessed value for units next to Skytrain stations.
While the Covid-19 dealt a serious shock to Vancouver real estate, our recent findings show that prices are still resilient in the apartment segment. Despite a drop in overall market activities, remaining buyers are still willing to pay premium prices to own an apartment in Greater Vancouver, especially those located in the prime location next to Skytrain stations.
Methodology
Our study is conducted using regression analysis on MLS data set for apartments listed and sold in 2020. We approximated walking distance across city blocks from each apartment unit to the nearest Skytrain station as the measure of distance to investigate this relationship. Additional control variables for apartment size, age, and location. Our regression analysis is conducted only for the following area to ensure sufficient data points for an accurate result: Vancouver West, Richmond, Vancouver East, Coquitlam, North Surrey, ‘Burnaby South, New Westminster, and Burnaby North.