COVID-19 forced up to 10% drop in Median Sale Price of Detached Homes in Greater Vancouver, according to a new data report by Roomvu and UBC Economist, Tom Davidoff
Vancouver, BC, Canada – May 27, 2020 — The current COVID-19 COVID-19 hit Greater Vancouver’s real estate market hard, with sales activity virtually disappearing overnight starting in mid-March.
Summary:
A new deep data analytics study by roomvu compared home prices before March 15 (Pre-COVID-19) and the sales between March 15, and May 27, 2020 (Post-COVID-19). The results show
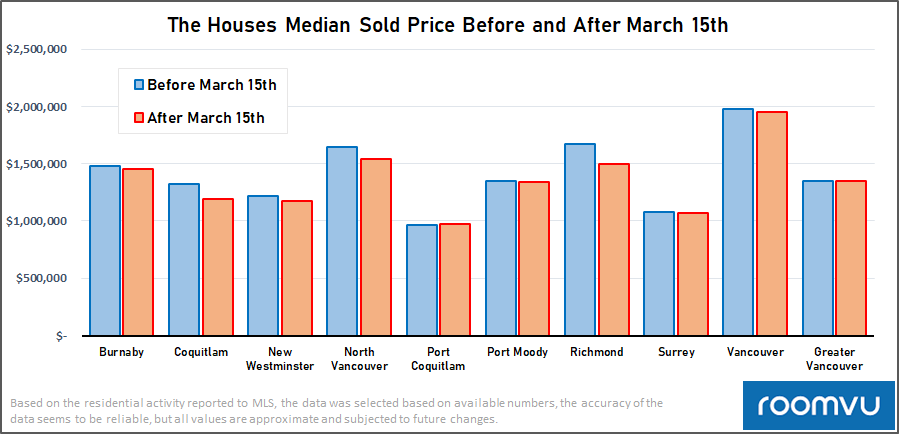
- The median sales price in the detached homes in Richmond was dropped by 10%, Coquitlam by 9%, and North Vancouver by 7% (Fig. 1).
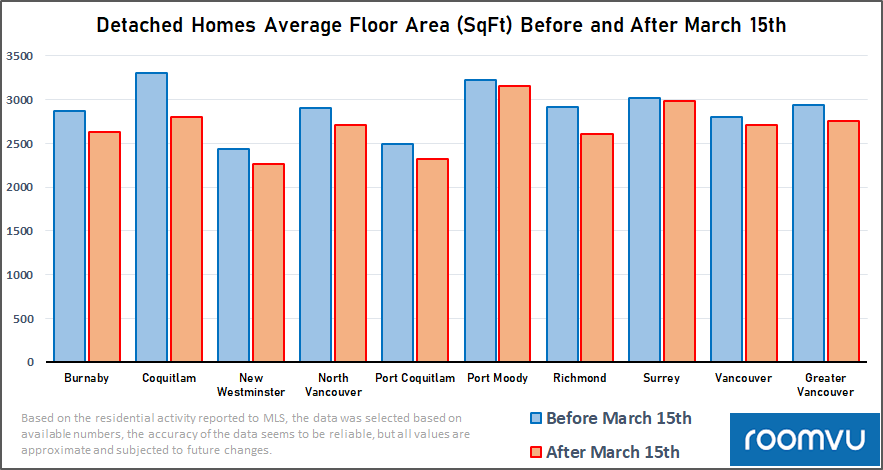
- The size of the average detached home sold in Greater Vancouver dropped by 6%, from 2934 to 2758 SqFt. Showing buyers are opting for smaller homes (Fig 4).
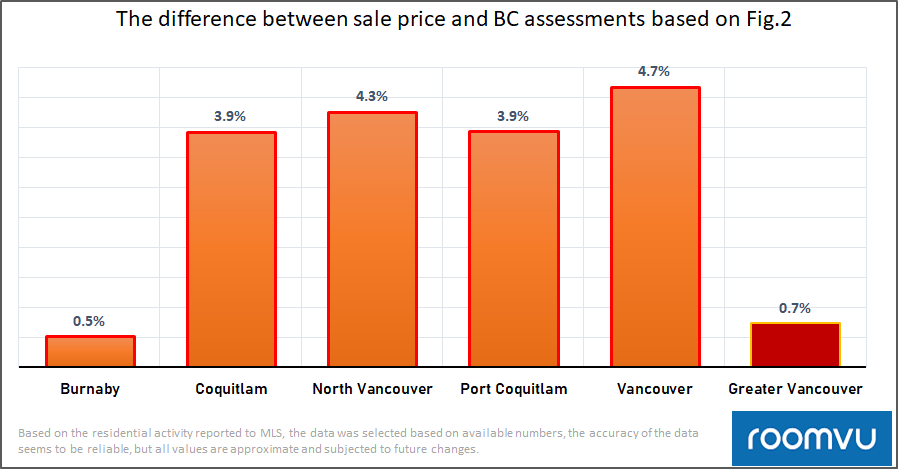
- When comparing sales prices to their BC Assessments, there was less than a 1% drop in the home sale prices pre and post COVID 19 (Fig 2).
The slow sales activity is a warning sign, according to Thomas Davidoff, economist and professor at UBC’s Sauder School of Business. “Low transaction volumes typically lead to low prices; however, it appears that sellers and buyers have disappeared from the market in similar proportions. Conditions in the market appear to have changed less than one might have expected before and after the shut down,” says Davidoff. “We continue to see a very strong relationship between price point and sales performance, both in terms of sales to listings and price relative to assessment.”
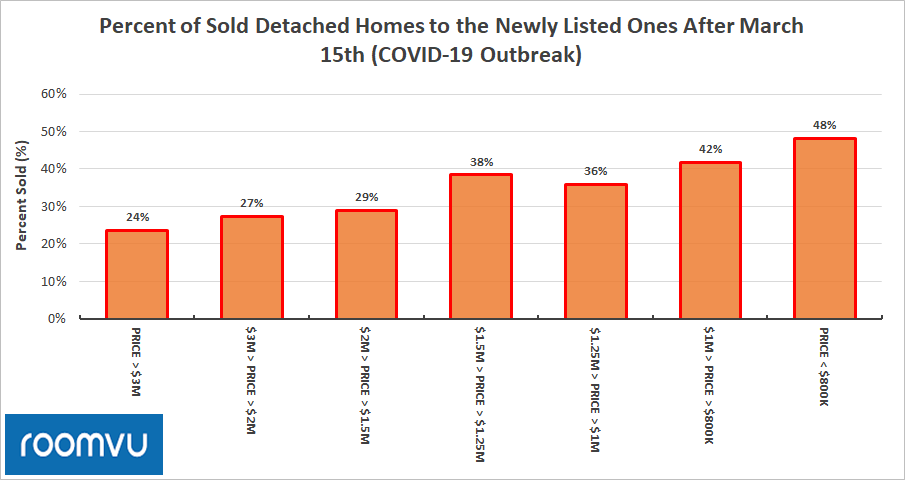
Davidoff points out that sales on the lower-end of the price band are showing a stronger sales performance than properties priced higher on the price spectrum.
The analysis by Roomvu, shows that detached home sold prices are starting to slip when comparing pre and post-COVID-19 median prices for almost all cities. The amount of slip could be different from one city to the next.
“There are difficulties when comparing pre- and post-COVID-19 average or median sale prices,” explains Sam Mehrbod, A local Realtor and Roomvu’s CEO. “Average or median prices can quickly become skewed based on outliers, while prices require ongoing trends to provide meaningful data”.
For these reasons, Roomvu examined pre-COVID-19 sales prices as they related to the property assessment values and compared this to post-COVID-19 sales prices, as they relate to property assessment values.
“Assessment value rises and falls based on all characteristics — sub-area trends, renovations, property attributes and market conditions, among others — that the difference between the sales price and the assessed value can become an excellent measure of a market’s activity,” says Sam Mehrbod.
To determine the impact of COVID-19, Roomvu examined sale prices and assessment values before March 15, 2020 and after March 15, 2020 for detached homes in Greater Vancouver municipal markets.
COVID-19 Impact on Detached Home Sales Price
The results show that prior to the COVID-19 sale prices were over 11.5% higher than assessed values in the greater Vancouver (before COVID-19), compared to 10.8% above assessments post Covid-19. The cities of Vancouver, North Vancouver, Coquitlam and Port Coquitlam saw the biggest impact. For other cities, the sale prices are more or less stable pre and after COVID-19 outbreak. New Westminster, Richmond and Surrey showed slight rises and Burnaby showed slight drops which all can be neglected.
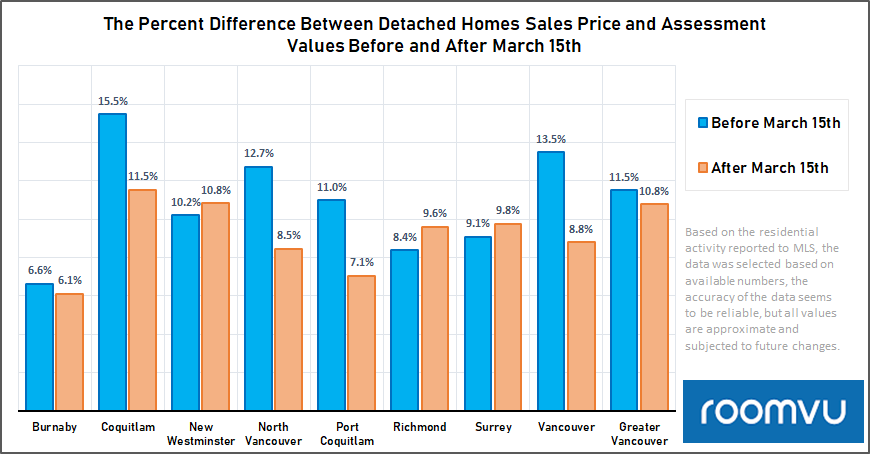
According to the data, detached homes sold for 6.6% to 15.5% above their assessed values before March 15, 2020. After March 15, 2020, detached homes were selling for 6.1% to only 11.6% above their assessed value.
“The difference isn’t massive but it does show that the market is slowly shifting,” says Mehrbod. “The market is starting to price in the impact of the COVID-19.”. The apartment sale study report by Roomvu also highlights the impact on sale prices for Greater Vancouver apartments.
The impact of COVID-19 on detached home sale prices was not uniform across Greater Vancouver.
- Port Coquitlam detached homes sold, on average, for 11% above assessed value pre-COVID and only 7.4% above assessed value post-COVID;
- Coquitlam detached homes sold, on average, for 15.5% above assessed value pre-COVID and only 11.5% above assessed value post-COVID;
- Vancouver detached homes sold, on average, for 13.5% above assessed value pre-COVID and only 8.8% above assessed value post-COVID;
- Surrey detached homes sold, on average, for 9.1% above assessed value pre-COVID and dropped to 9.8% above assessed value post-COVID;
- New Westminster detached homes sold, on average, for 10.2% above assessed value pre-COVID and for 10.8% above assessed value post-COVID.
- North Vancouver detached homes sold, on average, for 12.7% above assessed value pre-COVID and for 8.5% above assessed value post-COVID.
- Richmond detached homes sold, on average, for 8.4% above assessed value pre-COVID and for 9.6% above assessed value post-COVID.
Buyers looking for detached home deals should consider shopping in the Tri-Cities or on the North Shore or City of Vancouver.
Sellers in Surrey, Richmond and New Westminster who still want to list should consider doing so soon, given the strength of the current market.
The effect of COVID-19 pandemic on the size of the houses is shown in Fig 4. It is clear that after March 14 the median size of the house in all cities has reduced. “This shows that buyers are typically opting for smaller homes post-Covid 19”, said Mehrbod.
Biggest COVID-19 Impact is Sales Volume
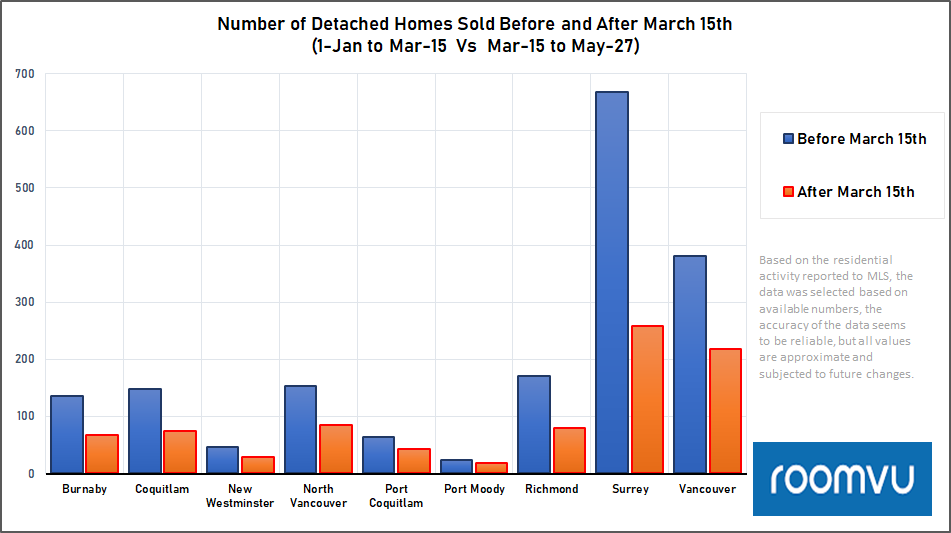
To confirm that sales volumes were seriously impacted, Roomvu analyzed the number of detached homes sold prior to March 15 (a 2.5-month period) and after March 15 (another 2.5-month period) and showed that in Figure 5.
This observation is clearly represented in the Figure 6 chart, where the higher priced detached homes, those priced over $3-million, had a lower sales to new listings ratio — at 20% — than detached homes priced below $800,000, where the sold to new listings ratio was more than double, at 48%.
One of the key factors that enabled the real estate market to survive the COVID-19 lockdown was the industry’s ability to adopt online and digital tools, such as virtual showings, digital tours, 3D floor plans like those offered by Matterport. To understand the full impact of virtual tours on the marketing of real estate and housing, please read our report here.
Conclusion: There is very little doubt that Greater Vancouver’s real estate market came to a standstill because of COVID-19 but it appears as if buyers are still pursuing the dream of homeownership. While it may take a few more months for the economic impact of the COVID-19 to work its way through the economy, and GVA’s housing market, it appears the real estate industry is well-positioned to help both buyers and sellers use tools to complete a sales transaction. For the time being it appears that actual prices are dropping by close to 1% and buyers opting for smaller detached homes. The luxury market is experiencing longer days on market for homes to be sold, compared to the more affordable homes.
Methodology
To develop a method to examine price differences and the impact the COVID-19 has had on property pricing, Roomvu examined average sale prices and assessed values pre-COVID (period between Jan. 1, 2020 and March 14, 2020) and compared this with average sales prices and assessed values post-COVID (period between March 15, 2020 and May 27, 2020).

Responses